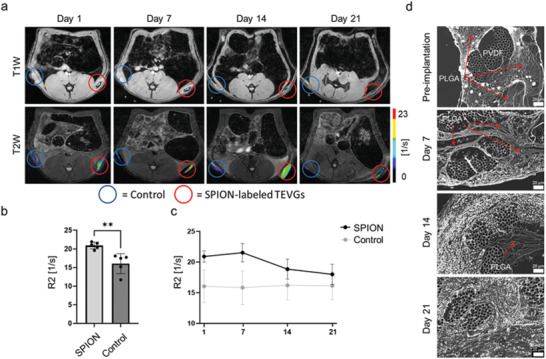
Figure 4.

In vivo longitudinal monitoring of SPION‐labeled PLGA degradation. a) T1‐ and T2‐weighted MRI images of subcutaneously implanted SPION‐labeled TEVGs (red circles) and unlabeled controls (blue circles) for 21 days. R2 color maps of both samples superimposed on the gray scale T2‐weighted images highlight the PLGA fibers degradation over time. b) Comparison of the R2 relaxation rate of SPION‐labeled TEVGs and unlabeled controls at day. c) R2 relaxation rate of SPION‐labeled and unlabeled TEVGs over 21 days. d) Ex vivo histological evaluation of explanted TEVGs via H&E staining (shown in gray scale). All values were obtained in triplicates: mean ± SD; t‐test b) and one‐way ANOVA c) and with Tukey post hoc correction test were applied; ns > 0.05, * p < 0.05, ** p < 0.01, *** p < 0.001, and **** p < 0.0001.
