Figure 5.

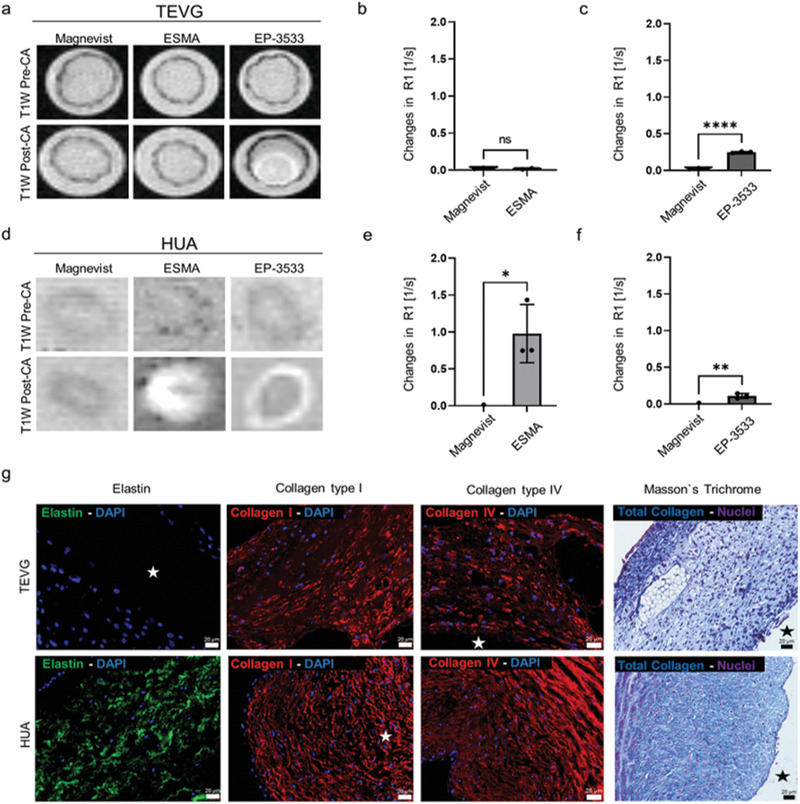
MRI investigation of ECM deposition in TEVGs and HUA. a) T1 weighted MRI images of TEVGs before (top) and after injection (bottom) of ESMA, EP‐3533, and Magnevist. b) Changes in R1 values were obtained by subtracting the pre‐ from the post‐injection values. R1 relaxometry of TEVGs do not markedly change after injection of ESMA. c) Compared to Magnevist, R1 values of TEVGs significantly change after injection of EP‐3533. d) MRI images of HUA (positive control) before (top) and after (bottom) injection of ESMA, EP‐3533, and Magnevist. e,f) R1 relaxometry of HUA after ESMA and EP‐3533 injection indicate the specificity of the probes to their targets. g) Representative histological images of TEVGs (top) and HUA (bottom) showing elastin (green), collagen type I (red), collagen type IV (red) by immunofluorescence, and total collagen (blue) via Masson's trichrome staining. No elastin deposition, but an abundant deposition of collagen (including type I and IV) is detectable in TEVGs. All values were obtained in triplicates: mean ± SD; t‐test with Tukey post hoc correction test was applied; ns > 0.05, * p < 0.05, ** p < 0.01, *** p < 0.001, and **** p < 0.0001. The star indicates TEVGs’ and HUA's lumen.
