Figure 6.

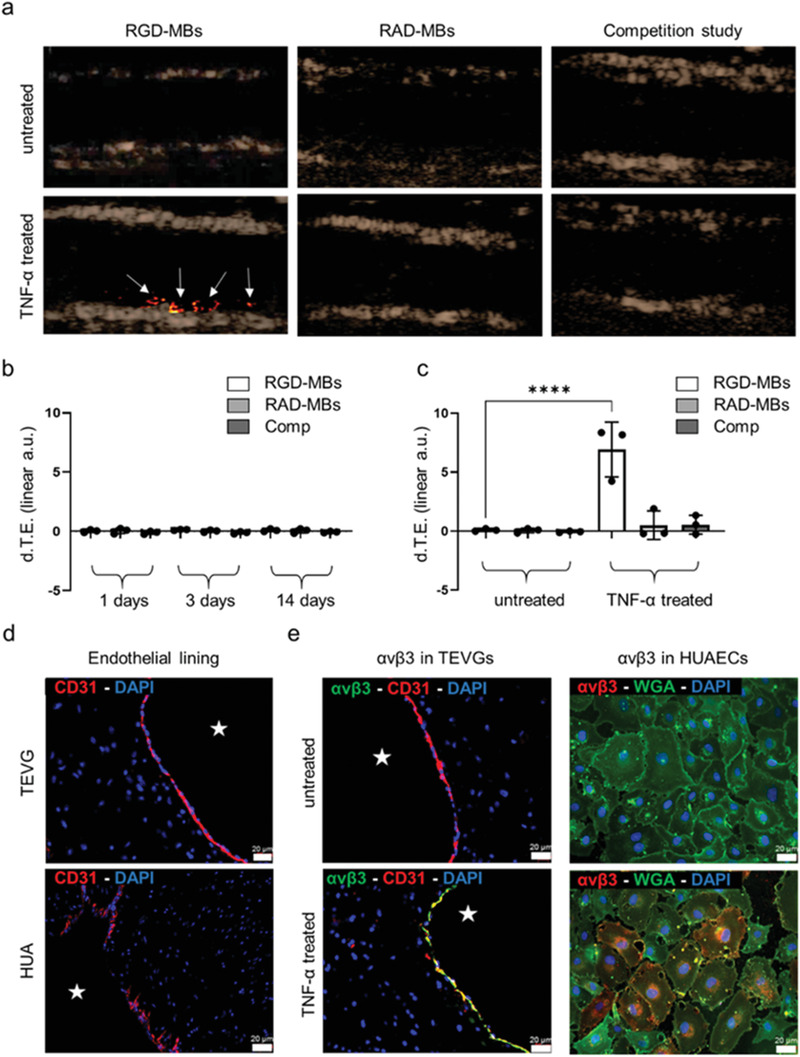
Molecular US imaging of α v β 3 integrin expression. a) Contrast mode ultrasound images are shown with a color‐coded overlay of the d.T.E., the latter indicating bound MBs (white arrows). While there is hardly any c[RGDfK]‐MB binding in untreated TEVGs (top), TNF‐α treatment of TEVGs results in a strong (bottom) c[RGDfK]‐MB attachment to the inner lumen of the TEVGs. In both, untreated and TNF‐α treated TEVGs no significant binding was observed after the injection of control c[RADfK]‐MB, and the injection of c[RGDfK]‐MB after blocking integrins with free c[RGDfK], respectively. b) Quantitative analysis of molecular US imaging data acquired at 1, 3, and 14 days of TEVGs’ bioreactor conditioning. c) Comparison between c[RGDfK]‐MB binding in TNF‐α treated and untreated TEVGs. d) Immunofluorescence histology of ECs (red) in TEVGs and HUA to evaluate the endothelial lining integrity and continuity. e) Immunofluorescence images of α v β 3 integrin expression in untreated (top) and TNF‐α treated (bottom) TEVGs and HUAECs. In TEVGs, histology shows colocalization of α v β 3 (red) with CD31 (green) only after TNF‐α injection. The basal level of α v β 3 integrin expression is investigated in HUAECs. Only after TNF‐α treatment, HUAECs show colocalization of α v β 3 (red) with wheat germ agglutinin (WGA) (green), indicating the cells’ nonactive phenotype. All values were obtained in triplicates: mean ± SD; t‐test with Tukey post hoc correction test was applied; ns > 0.05, * p < 0.05, ** p < 0.01, *** p < 0.001, and **** p < 0.0001. The star indicates TEVGs’ and HUA's lumen.
