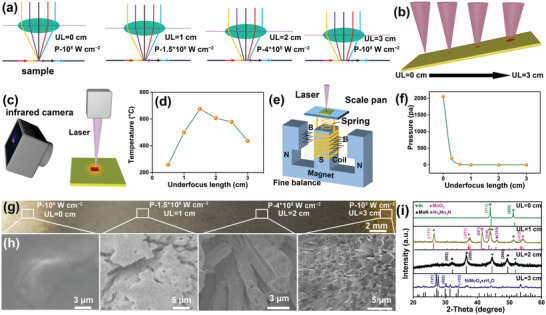
Figure 3.

a,b) Schematic diagrams of different laser underfocus modes. c) Synthetic scheme of laser thermal image and d) according laser‐produced temperature. e) Synthetic scheme of laser‐induced pressure test and f) according laser‐induced pressure. g) Photograph, h) SEM images and i) XRD patterns of four points synthesized at different degree of underfocus laser with UL ranged from 0 to 3 cm with interval of 1 cm on the NiMoO4·xH2O/rNS.
