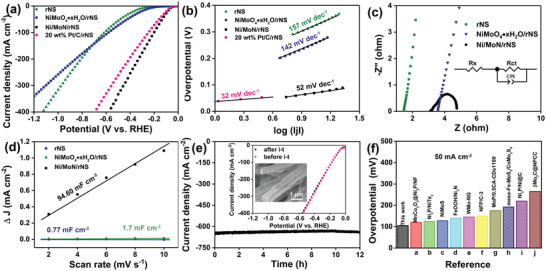
Figure 4.

a) LSV curves and b) Tafel slopes of rNS, NiMoO4·xH2O/rNS, Ni/MoN/rNS, and 20 wt% Pt/C/rNS toward HER in 1 m KOH. c) Nyquist plots with the overpotential of 76 mV (inset: the equivalent circuit) and d) Electrochemical area of rNS, NiMoO4·xH2O/rNS, Ni/MoN/rNS. e) Long‐term stability of Ni/MoN/rNS toward HER (inset: The polarization curves of Ni/MoN/rNS before and after i–t testing and SEM image of Ni/MoN/rNS after i–t testing). f) Comparison of the required overpotential at a current density of 50 mA cm−2 for the Ni/MoN/rNS with reported state‐of‐the‐art catalysts.[ 15 , 35 ]
