
Figure 5.
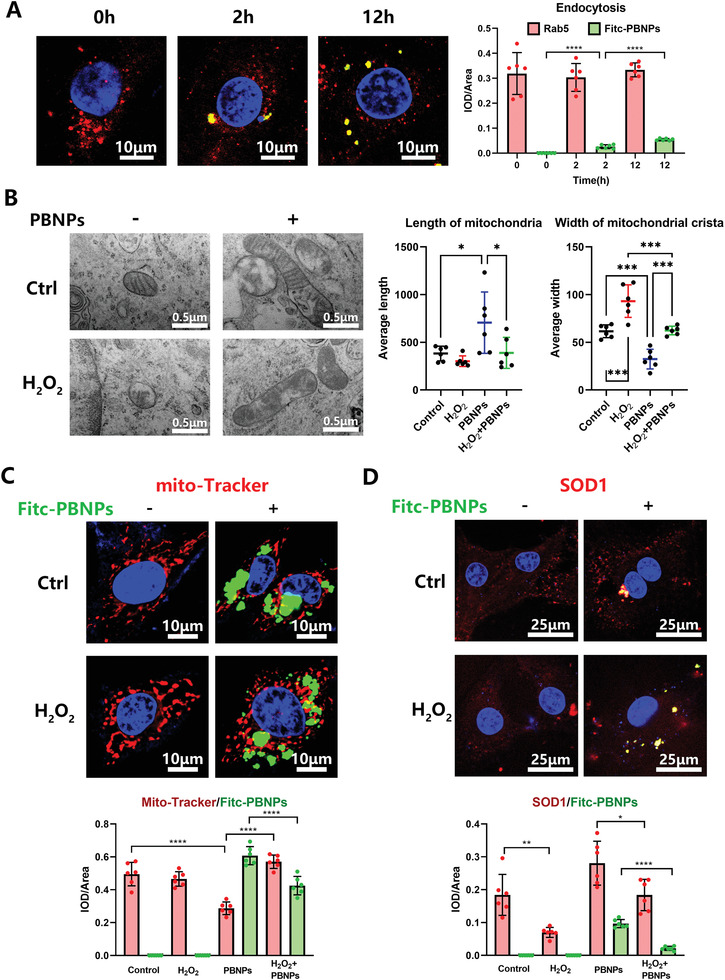
Localization of PBNPs in NPCs. A) Fitc‐PBNPs was treated to NP cells with increasing time and colocalization of Rad5 with Fitc‐PBNPs was detected by Confocal. Statistical chart shows IOD/area of red and green fluorescence. B) TEM images of intracellular mitochondria in NP cells, after H2O2 (0.6 × 10⁻³%) stimulation and PBNPs (2 µg mL−1) treatment. Statistical chart shows length of mitochondria and width of mitochondria crista. C) NP cells, after H2O2 (0.6 × 10⁻³%) stimulation and Fitc‐PBNPs (2 µg mL−1) treatment was strained with mito‐Tracker. Statistical chart shows IOD/area of red and green fluorescence. D) After H2O2 (0.6 × 10⁻³%) stimulation and Fitc‐PBNPs (2 µg mL−1) treatment, colocalization of SOD1 with Fitc‐PBNPs was detected by Confocal. Statistical chart shows IOD/area of red and green fluorescence. The data were presented using mean ± S.D. * indicates p < 0.05, ** indicates p < 0.01, *** indicates p < 0.001, **** indicates p < 0.0001. The experiments above were repeated six times.