
Figure 6. Distinct YAP targets drive opposite adhesive behavior of binary cancer classes.
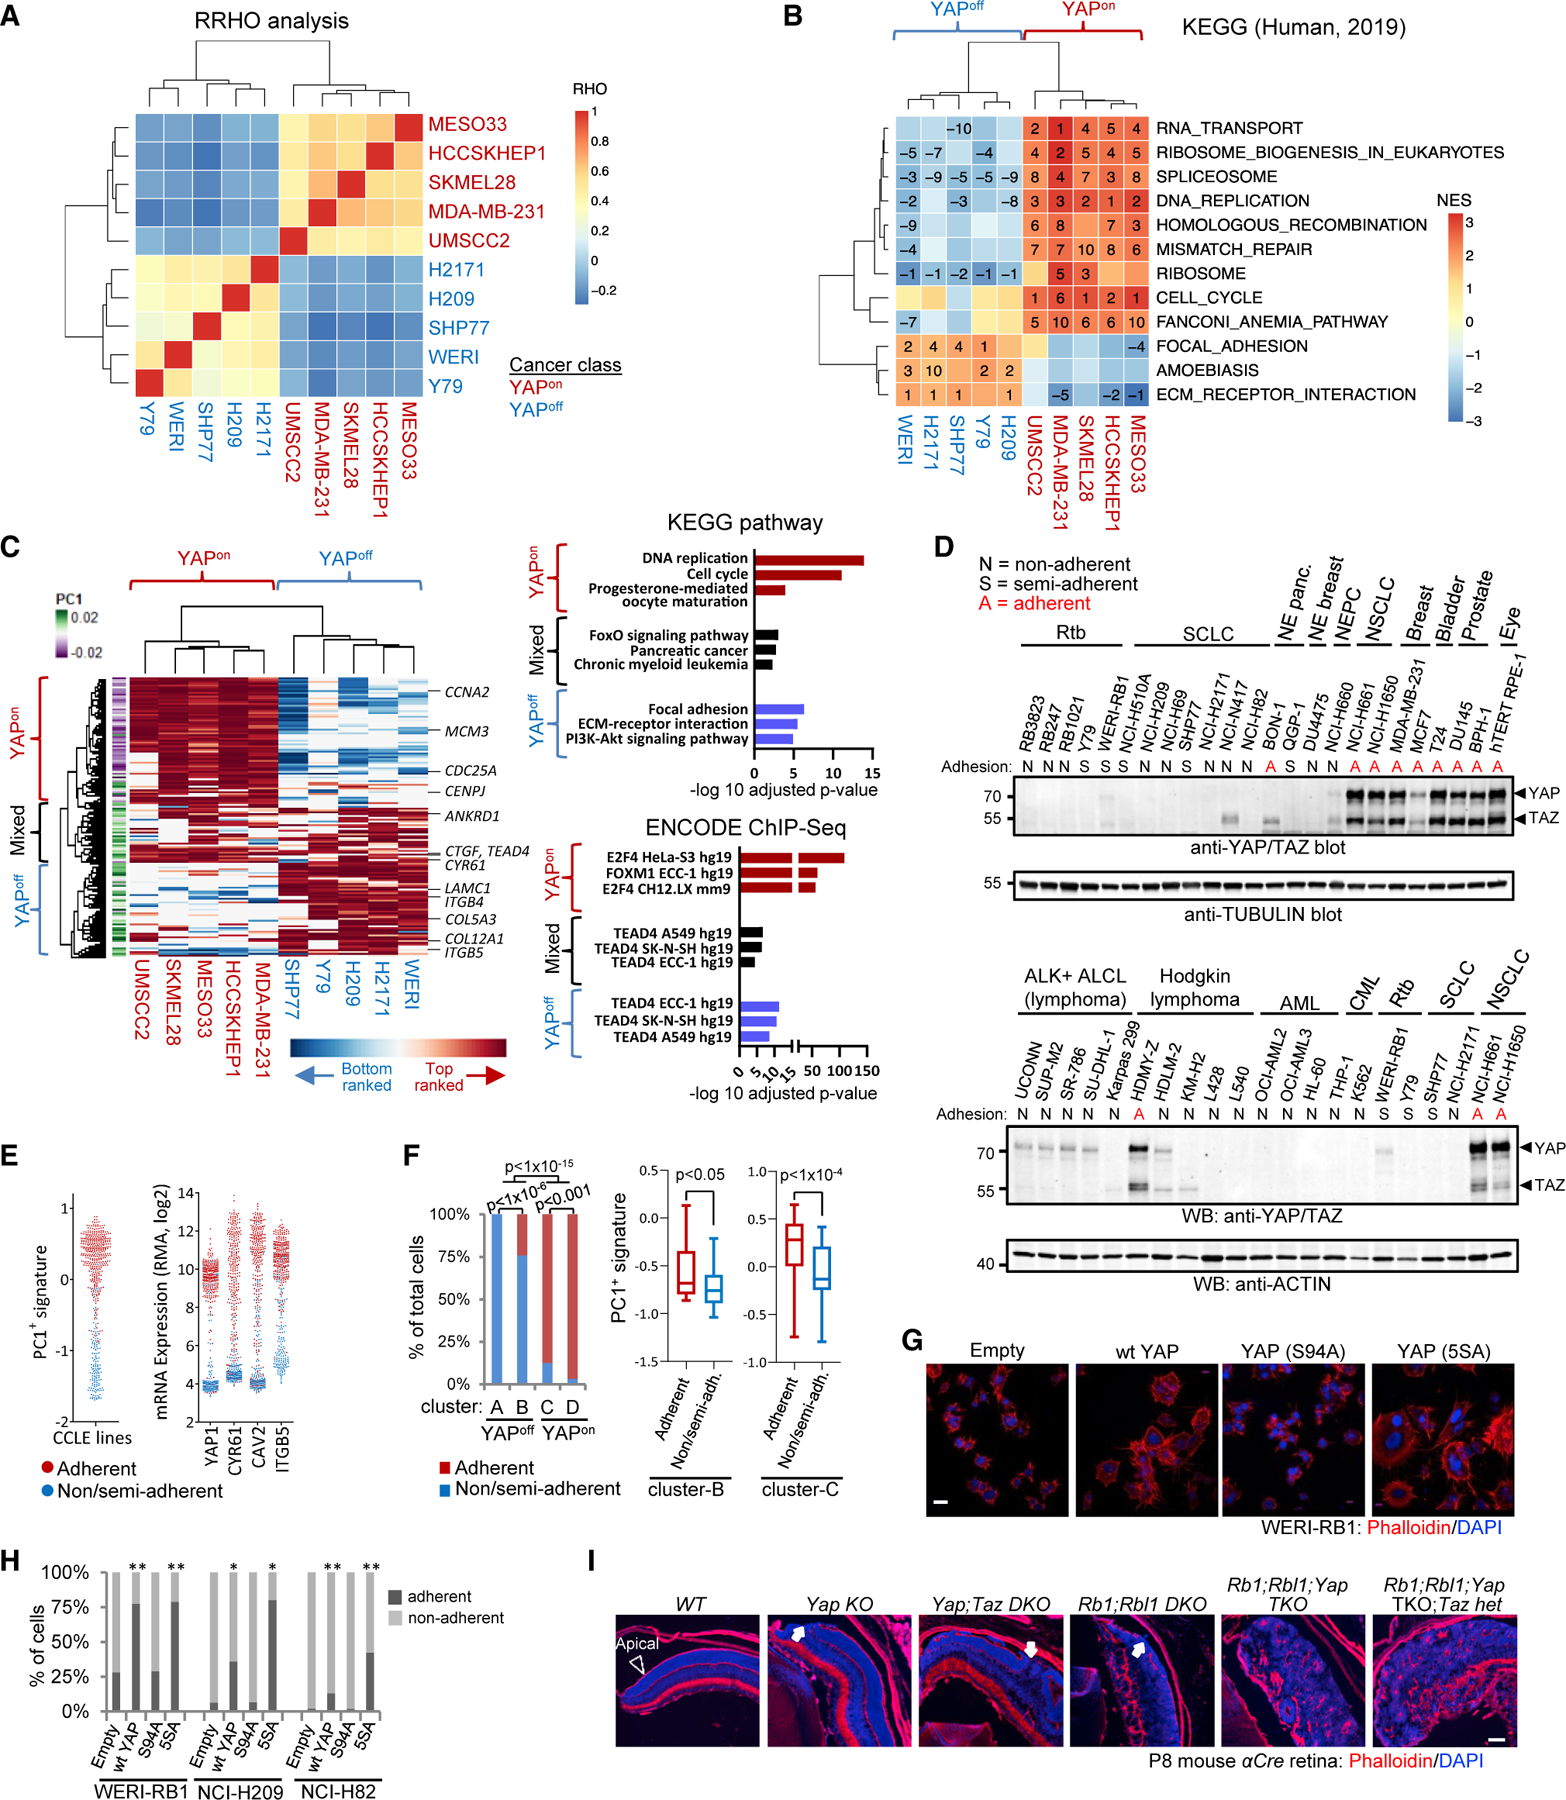
(A) Hierarchical clustering of RHO coefficients from rank-rank hypergeometric overlap (RRHO) to compare YAP targets in YAPon and YAPoff lines.
(B) Hierarchical clustering of KEGG pathways enriched in YAP targets. Numbers: rank (stats in Table S6).
(C) Unsupervised clustering of the top YAP-induced genes (left). Graphs of the top enriched KEGG pathways and ENCODE TFs (right).
(D) YAP/TAZ western blots and adhesion type for indicated cell lines.
(E) PC1+ signature scores (left) and levels of select genes (right) in CCLE lines with indicated adhesive behavior.
(F) Proportion of adherent and non/semi-adherent cell lines in cancer classes (left; Fisher’s test); PC1+ signature score in the adherent and non/semi-adherent cell lines from clusters B and C (right).
(G) Phalloidin (F-actin) staining of WERI-RB1 Rtb cells transduced with the indicated vectors.
(H) YAP increases adhesion in YAPoff cell lines. n R 3; Fisher’s test: *p < 0.05, **p < 0.01.
(I) Phalloidin staining of retina from aCre mice of the indicated genotypes (abbreviations, Figure 1B). Arrowhead, apical surface; arrows, apical breaks.