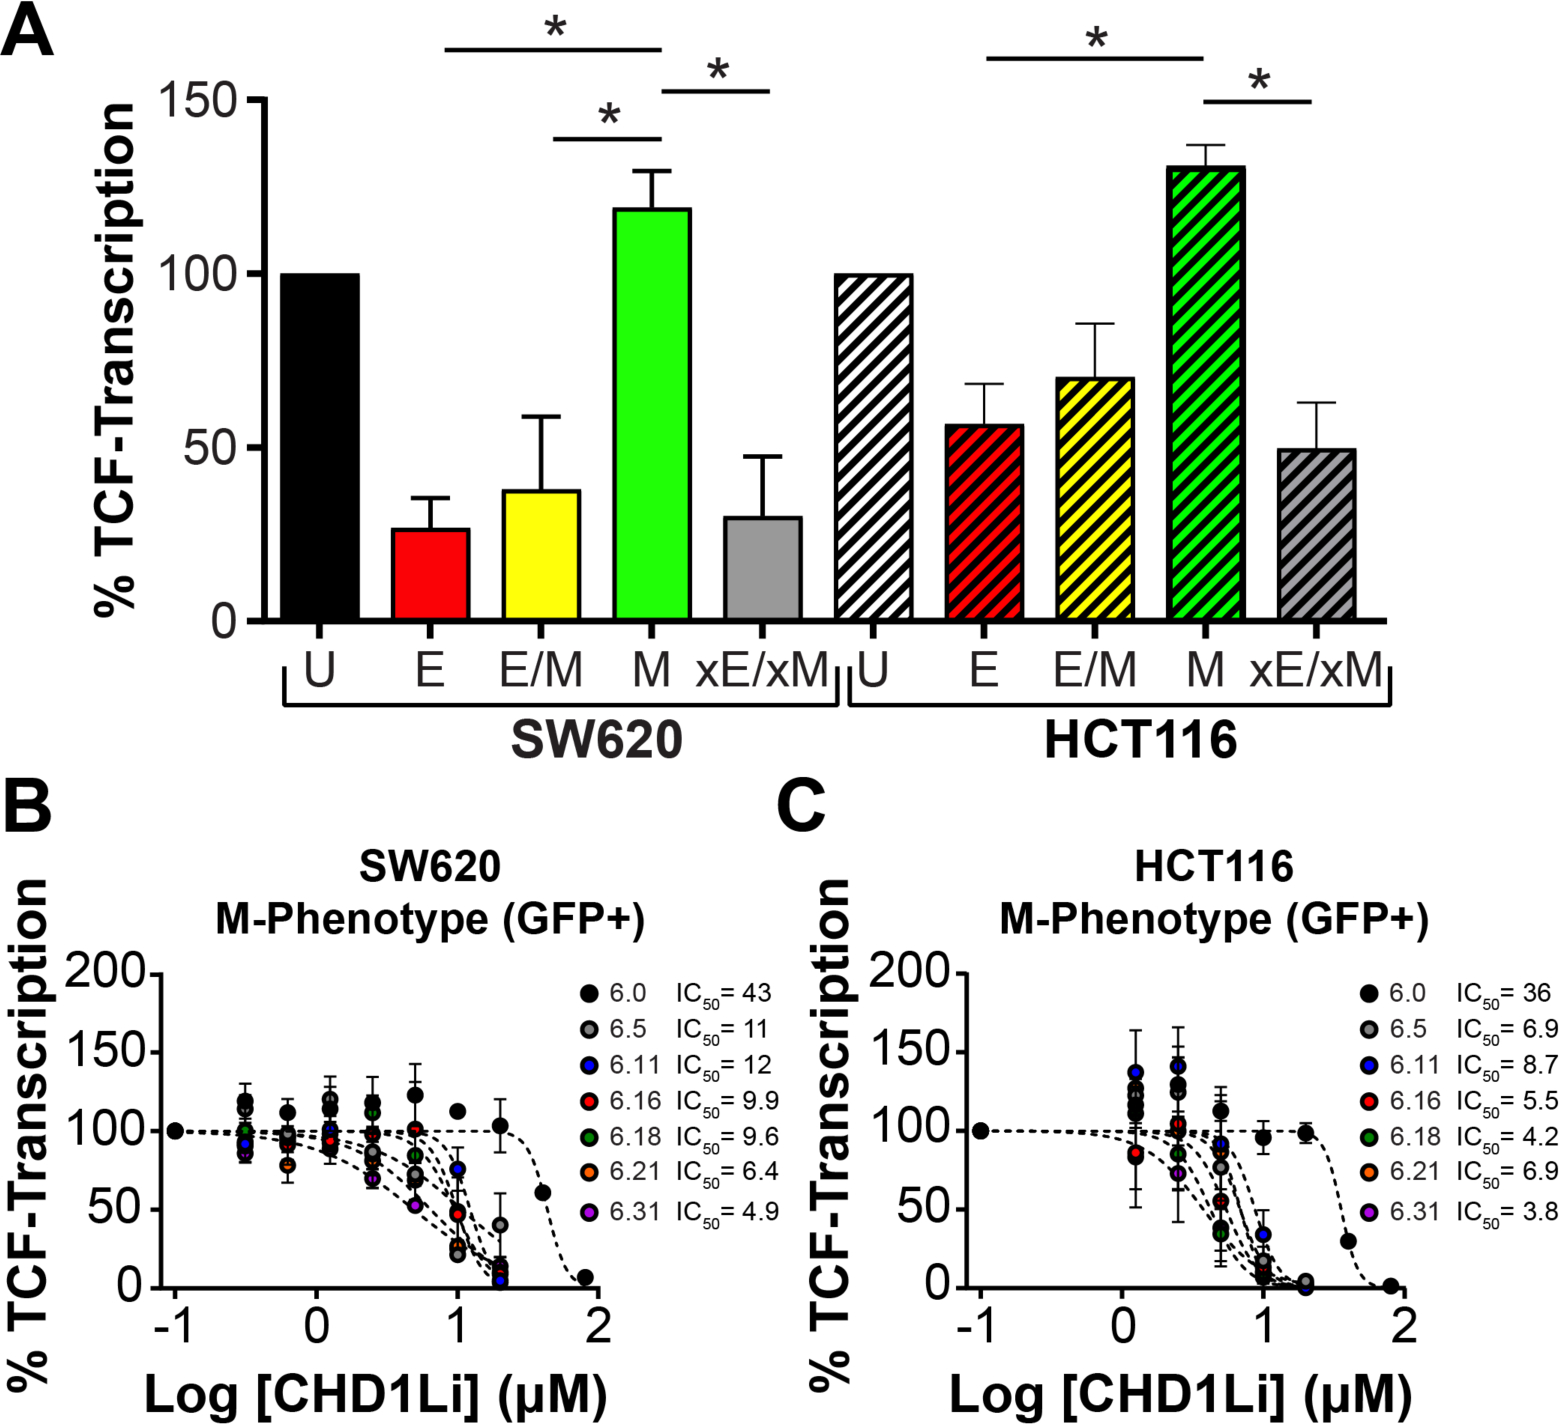
Figure 2. CHD1Li downregulate CHD1L mediated TCF-transcription in M-Phenotype cells.

(A) TCF-transcriptional activity in isolated SW620 and HCT116 EMT phenotypes. P-values were calculated by one-way ANOVA where *P<0.05. Dose-response graphs of (B) SW620 and (C) HCT116 M-Phenotype monolayer cell culture treated with lead CHD1Li for 24 h, measuring TCF-transcription via the TOPflash luminescent reporter assay. Data is normalized to cell viability and is shown as mean ± SEM of duplicate experiments. Cell phenotypes are defined as U (unsorted), quasi-epithelial (E, RFP+), -hybrid (E/M, RFP+/GFP+); -mesenchymal (M, GFP+); and stable epithelial/mesenchymal population (xE/xM, RFP−/GFP−).
