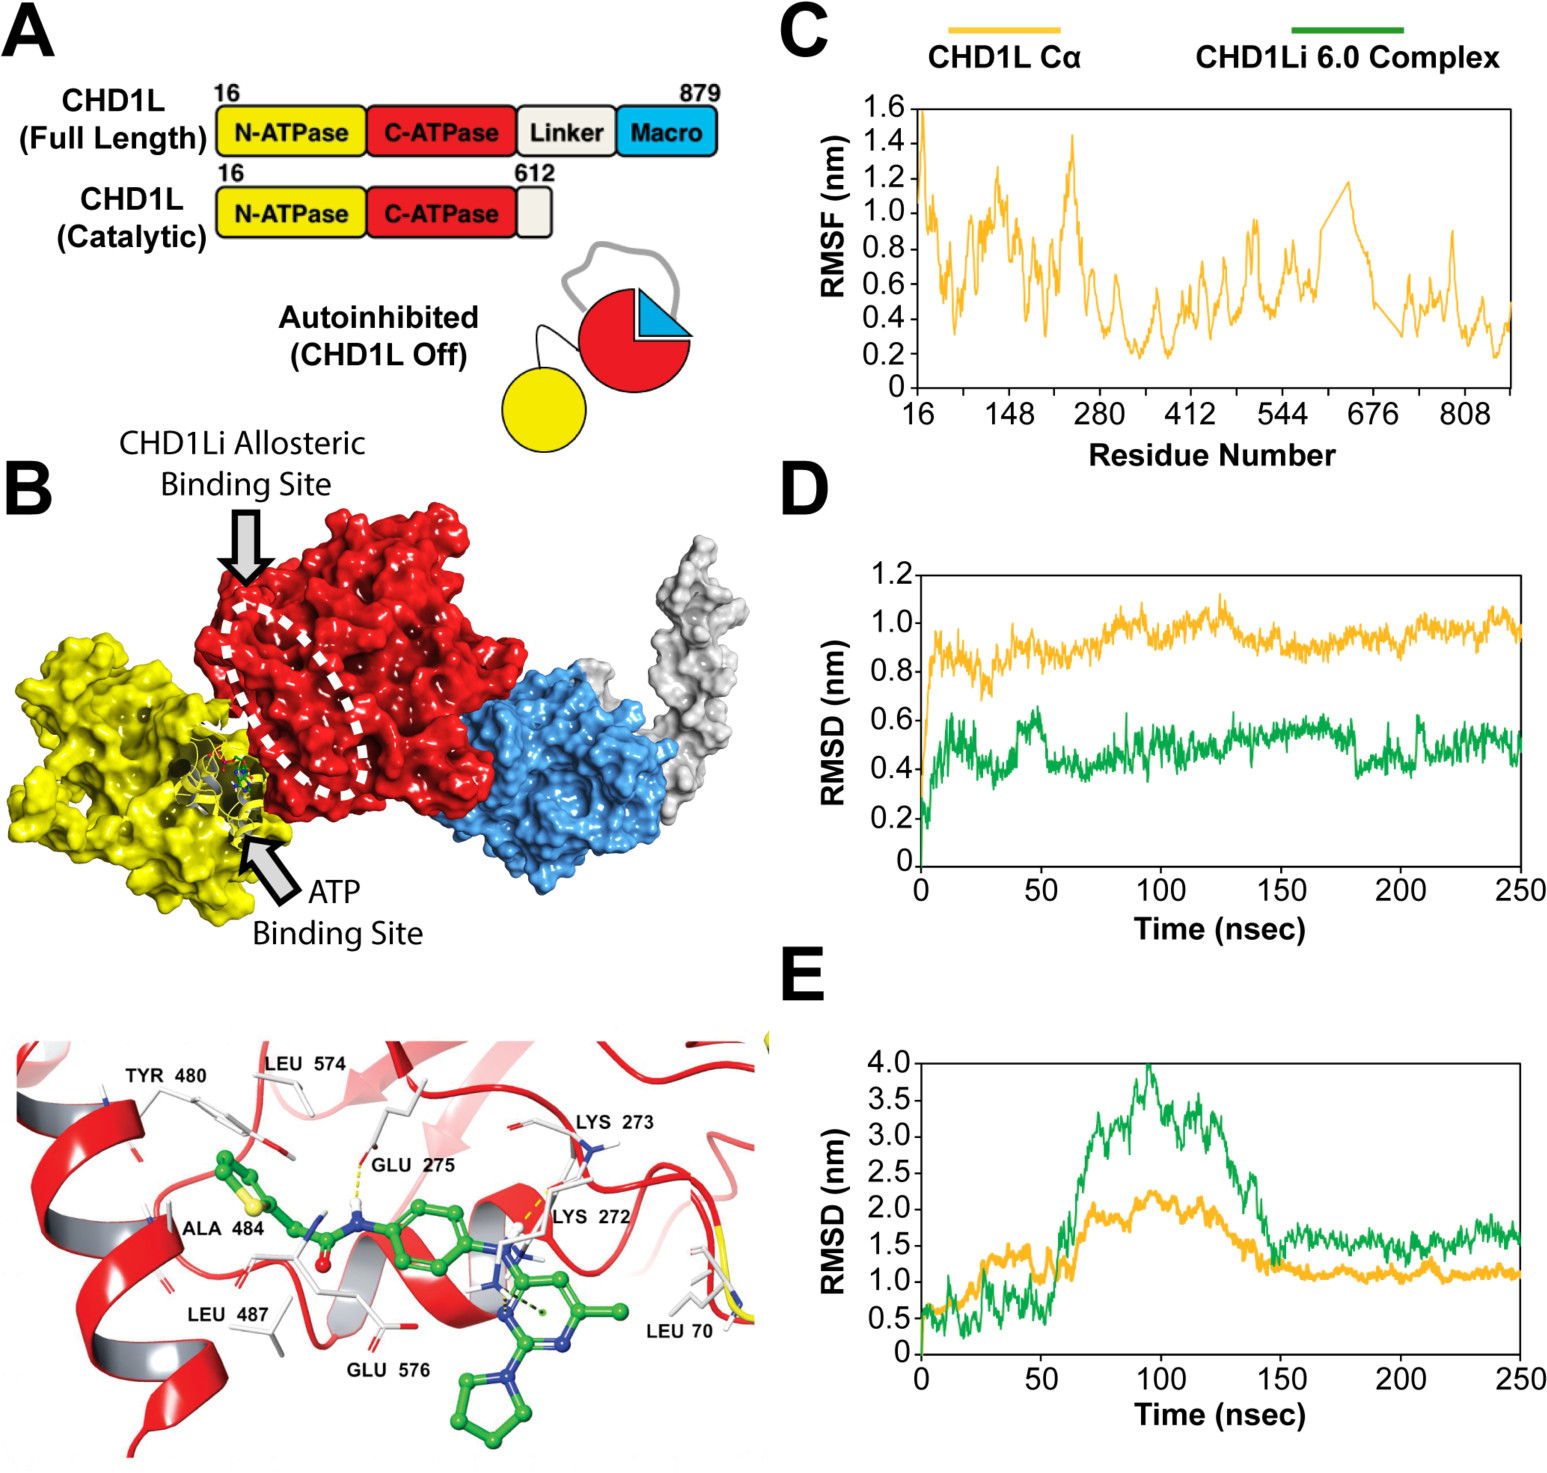
Figure 6.

(A) CHD1L domain architecture showing the autoinhibited protein state. (B) Molecular surface representation of the protein (PDB ID: 7EPU) showing the most plausible SiteMap-predicted CHD1Li binding site (white dashed oval). The structure is color coded, including macrodomain (blue), linker region (grey), C-ATPase (red) domain, and N-ATPase domain (yellow). A bound ADP, part of the CHD1L crystal, is shown as a ball and stick model in the N-ATPase ATP binding site. Note, the PDB structure shown in panel B is missing part of the linker region, which normally extends to the C-ATPase domain and is depicted in the CHD1L cartoon in panel A. Below the surface representation is the lead CHD1Li 6.0 bound in the C-ATPase allosteric site. (C) RMSF plot of the apo CHD1L residues highlighting the reduced structural flexibility of C-ATPase compared to N-ATPase. (D) RMSD evolution of CHD1Li 6.0 at the C-ATPase and (E) N-ATPase allosteric sites, respectively over the 250 ns molecular dynamics trajectory
