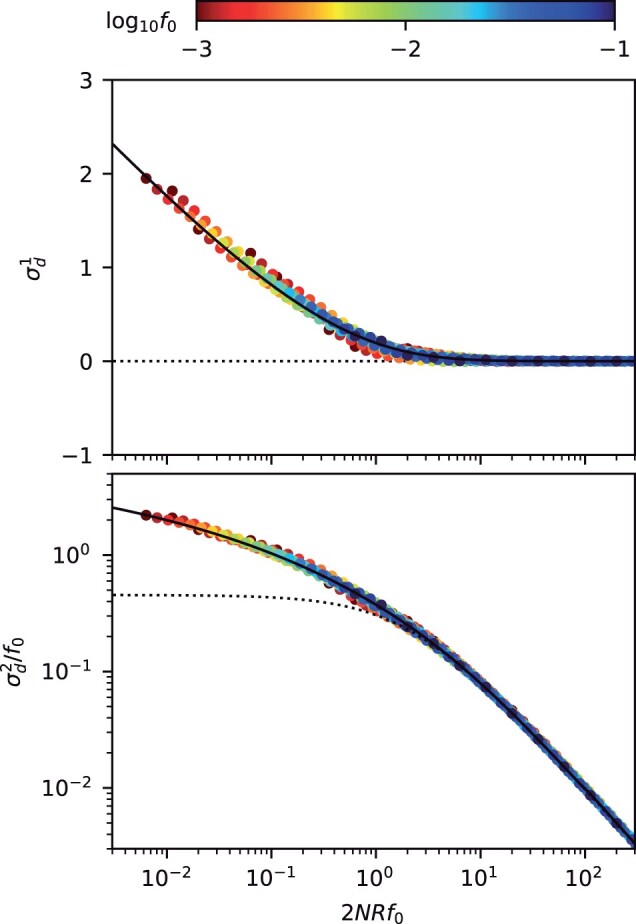
Fig. 4.

Frequency-resolved LD between neutral mutations as a function of the scaled recombination rate. An analogous version of Fig. 3, showing the first (top) and second (bottom) LD moments in Equation (7) for pairs of neutral mutations with a range of recombination rates, . As above, symbols denote the results of forward time simulations, and solid lines denote the theoretical predictions from Equations (D21) (top) and (D22) (bottom). Dashed lines show the classical predictions for the limit (Ohta and Kimura 1971). The “data collapse” in both panels indicates that frequency-weighted LD is primarily determined by compound parameter . Low scaled recombination rates () lead to an excess of coupling linkage (), which qualitatively resembles the effects of antagonistic epistasis (ϵ).
