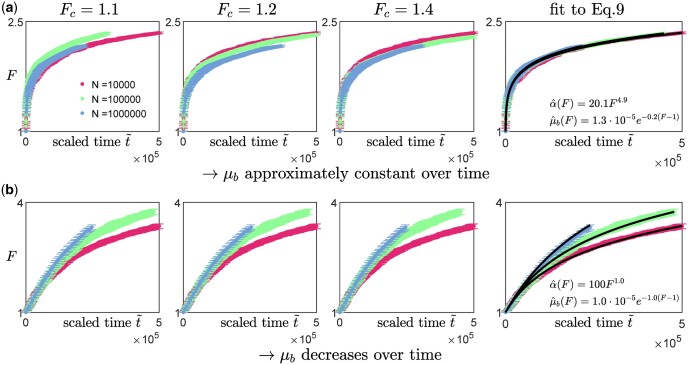
Fig. 4.
Inferring the type of epistasis from synthetic data obtained from simulations on a) a diminishing-returns landscape with and , and b) a House-of-Cards/uncorrelated landscape with and using different values of N. The time between successive measurements is at least a hundred (with the initial growth rate set to be 1), and each data point represents the average over 10 replicates with the error bars indicating the 95% confidence interval around the mean. The first 3 columns (from the left) are scaled trajectories obtained with different values of Fc used for estimating the initial fitness gradient. In both a) and b), how the shape of the trajectories change with N remains approximately consistent across all values of Fc, suggesting that the qualitative results are robust to how the initial fitness gradients are obtained. The last, right-most column show scaled trajectories where the initial fitness gradients are estimated from fitting the trajectories to Equation (9) assuming that the landscape takes the following form: and , with α0, and γ being free parameters used in the fitting. The solid black lines represent the fits to the data, while the inferred landscapes and are shown in the insets. Based on how the shape of the scaled trajectories vary with N, one would infer that μb remains relatively constant in a) and decreases over time in b).

