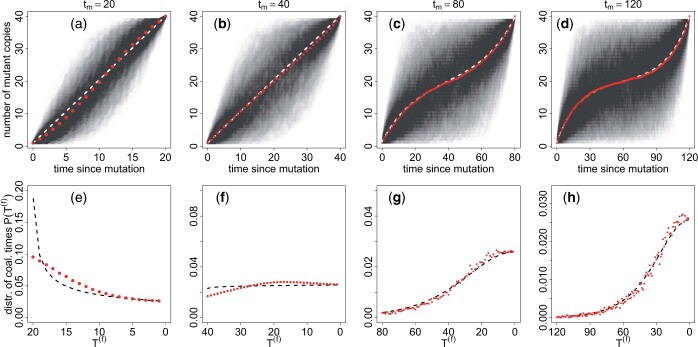
Figure 3.
Average frequency (a–d) and coalescence time distribution (e–h) of an allele fixing in a diploid population of constant size Nc = 20 in exactly generations, starting as a single copy (i.e. p0 = (2Nc)−1). The red dots are the results of Wright–Fisher simulations, and the black and white dashed lines are calculated with Equations (4b) (first and second columns), (4a) (third and fourth columns), and (3b). In (a)–(d), we show the variability of the fixation process by overlapping 1,780 fixing trajectories. The (numerically estimated) probability, for a mutant that appears at the onset of the contraction, to fix in less than generations is 0.006, 0.16, 0.64, and 0.86 for = 20, 40, 80, and 120, respectively (for this particular value of Nc).

