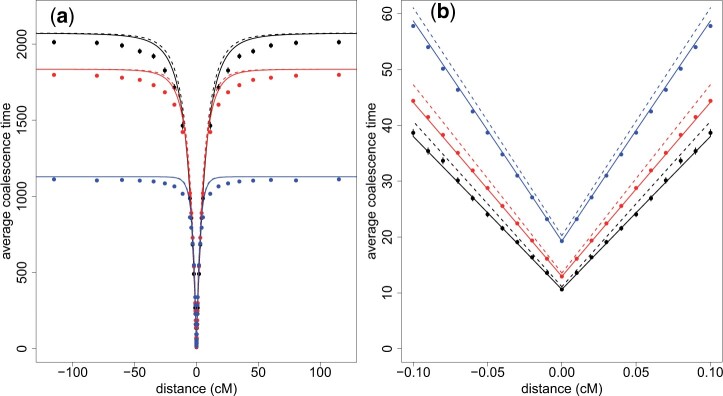
Figure 4.
Average coalescence time at a linked locus, as a function of the recombination distance from the focal locus where a mutant fixed in exactly tm generations, starting from a single copy tm generations ago. tm = 15 in black, tm = 20 in red, and tm = 40 in blue. The dots are calculated with 2-locus WF simulations, and compared to Equation (5) with either a numerical estimation (solid lines) or a theoretical estimation (dashed lines) of and . Nc = 20. N0 = 1,500. The population experienced a contraction tc = tm generations ago.

