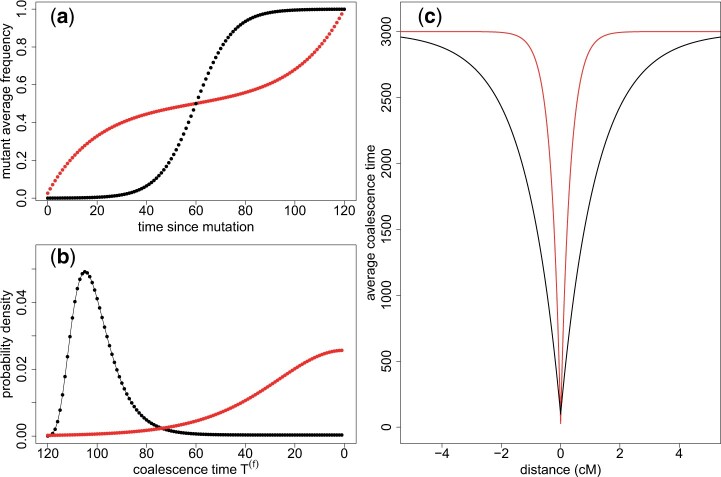
Figure 5.
Comparison between troughs of diversity resulting from a selective sweep (black) and a neutral sweep (red), for the same fixation time (corresponding to s ≈ 0.1 in the selective case). Frequency of the fixing allele as a function of time a), coalescence time distribution b), and diversity around the fixing site along the genome using Equation (5) c). N1 = 1500, Nc = 20, and N0 = 2.97 × 10⁴.

