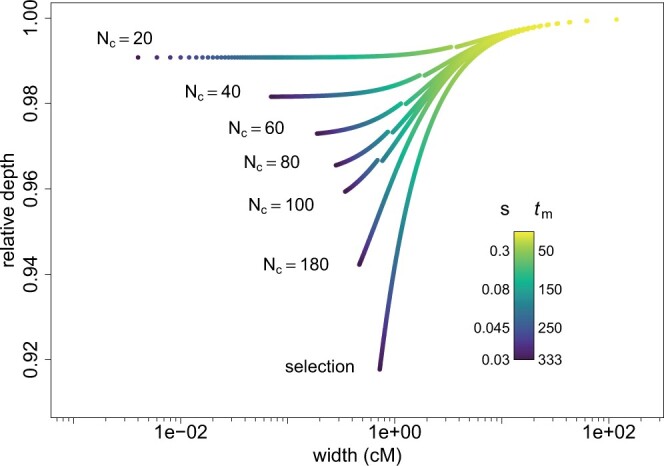
Figure 6.

Relative depth as a function of the width of the diversity troughs, for different values of tm and Nc in the neutral case and for selective scenarios with identical fixation times. tm goes from 1 to 333 by increments of 1, the corresponding values of the selection coefficient s are indicated on the left of the legend bar (for all of them we have N1s ≫ 1). N1 = 1,500. N0 is given by Equation (7) and depends on Nc and tm. The jumps in the neutral curves for Nc = 20, 40, 60, 80, and 100 are due to the use of 2 different approximations for the frequency of the mutant, Equations (4a) and (4b) and are located at tm = 2Nc.
