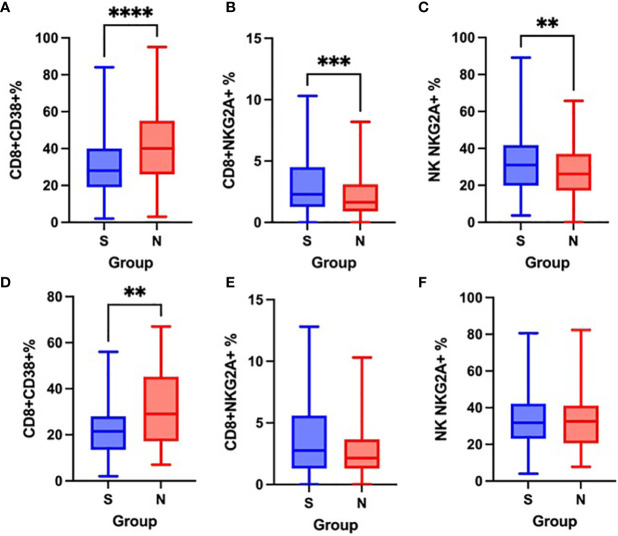
Figure 7.
Differences in the proportion of CD8+CD38+ cells on admission (A) and after one week (D), CD8+NKG2A+ cells on admission (B) and after one week (E) and NK NKG2A+ cells on admission (C) and after one week (F) between survivors [S] and non-survivors [N], Mann-Whitney test. **p < 0.01; ***p < 0.001; ****p < 0.0001.

