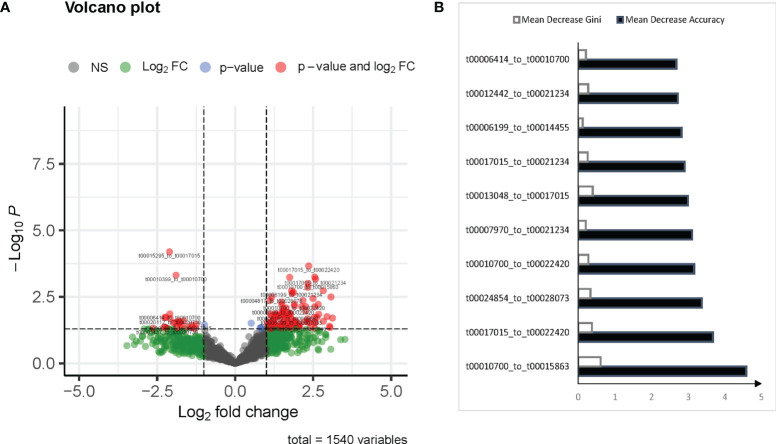
Figure 1.
mtRNA diagnostic panel. (A) Volcano plot of differentially expressed mtRNAs between normal and pulmonary tuberculosis (TB). (B) Mean Decrease Accuracy shows the relative degree to which a factor improves the accuracy of the forest in classification prediction; Mean Decrease Gini assigns a weight of importance to each parameter, which improves accuracy of the prediction.

