Figure 2.
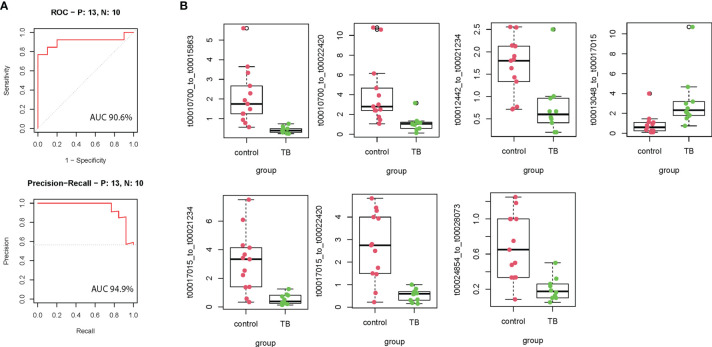
The performance of the training model in the discovery cohort. (A) Seven model selected mtRNA expression levels in the discovery cohort. (B) ROC curve and PR curve of the diagnostic prediction model with mtRNA markers in the discovery cohort; All box plots are statistical significant, p <0.01.

