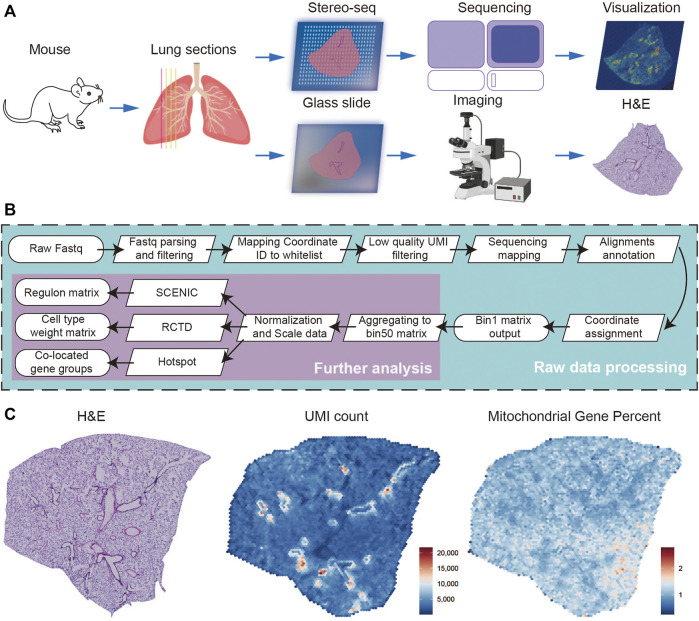
FIGURE 1.
Overview of the experimental, data analysis workflow, and Stereo-seq data quality control. (A) Four lung sections from female mouse were collected, and the first was stained with H&E, the subsequent three for Stereo-seq experiments. (B) The analysis workflow for Stereo-seq datasets. (C) The H&E of the first section (left), the UMI (middle), and the percent of mitochondrial genes (right) spatial distribution patterns of the first Stereo-seq section.

