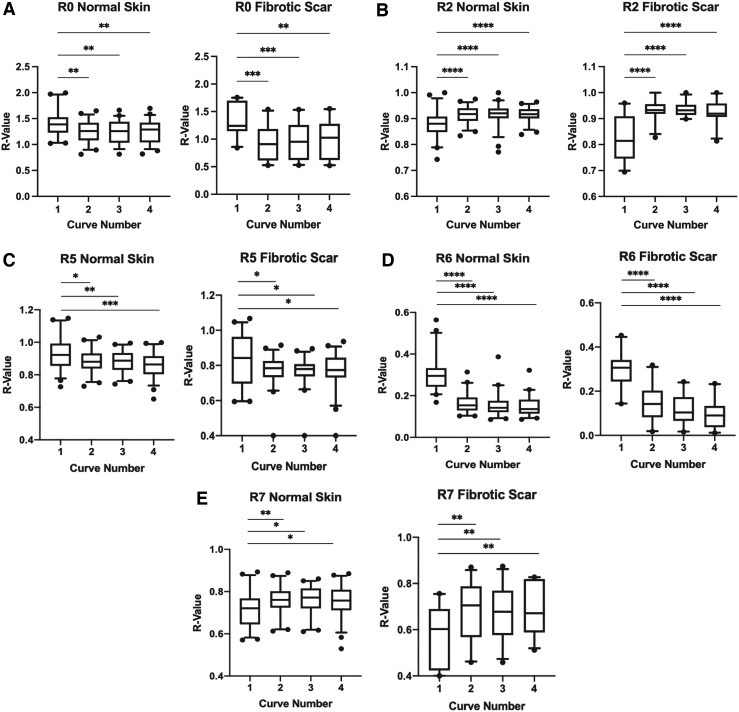
Figure 4.
Individual comparison of curve 1 to curves 2, 3, and 4 within the R0 (A), R2 (B), R5 (C), R6 (D), and R7 (E) parameters in normal skin and FS (*p < 0.05, **p < 0.01, ***p < 0.001, ****p < 0.0001). R-values in the R0, R2, R5, R6, and R7 parameters directly correlate with overall skin elasticity. Higher R-values represent greater overall skin elasticity while lower R-values represent less overall skin elasticity.

