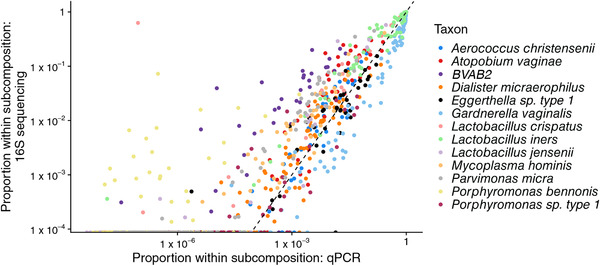
FIGURE 1.

The relative abundance of taxa observed with qPCR versus the relative abundance of the taxa observed by sequencing a hypervariable region of the 16S gene. Note that the subcompositional relative abundance is shown, where the subcomposition is to taxa observed by qPCR. Specifically, is plotted against . In this data set, and . This figure appears in color in the electronic version of this paper, and any mention of color refers to that version
