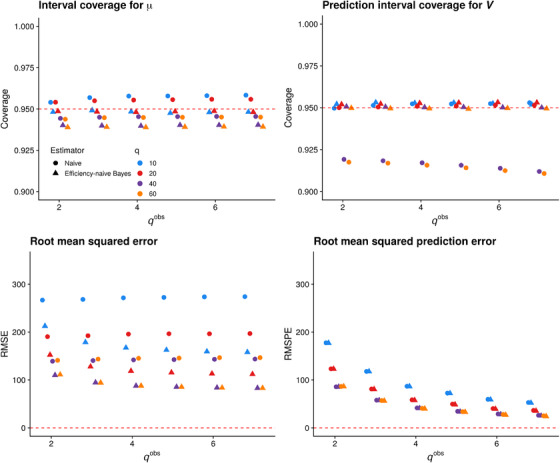
FIGURE 2.

Performance of the naïve estimator (circles) and proposed efficiency‐naïve Bayesian estimator (triangles) versus for . Top row: coverage of nominal 95% intervals based on both estimators. Bottom row: root mean squared error and root mean squared prediction error for both estimators. In each plot, color denotes q, while shape denotes the estimator. This figure appears in color in the electronic version of this paper, and any mention of color refers to that version
