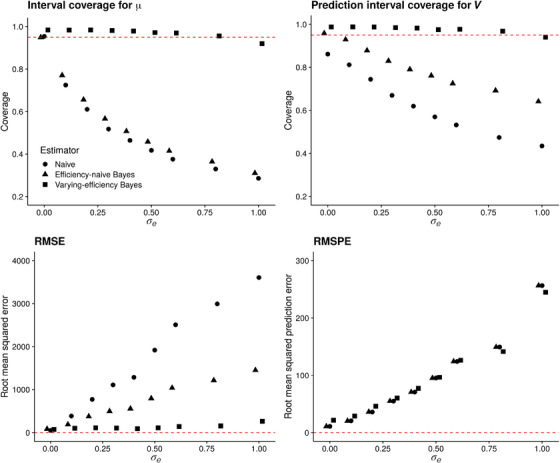
FIGURE 3.

Performance of the naïve estimator (circles), efficiency‐naïve Bayesian estimator (triangles), and varying‐efficiency Bayesian estimator (squares) versus for and . Top row: coverage of nominal 95% intervals based on each estimator. Bottom row: root mean squared error and root mean squared prediction error for all estimators
