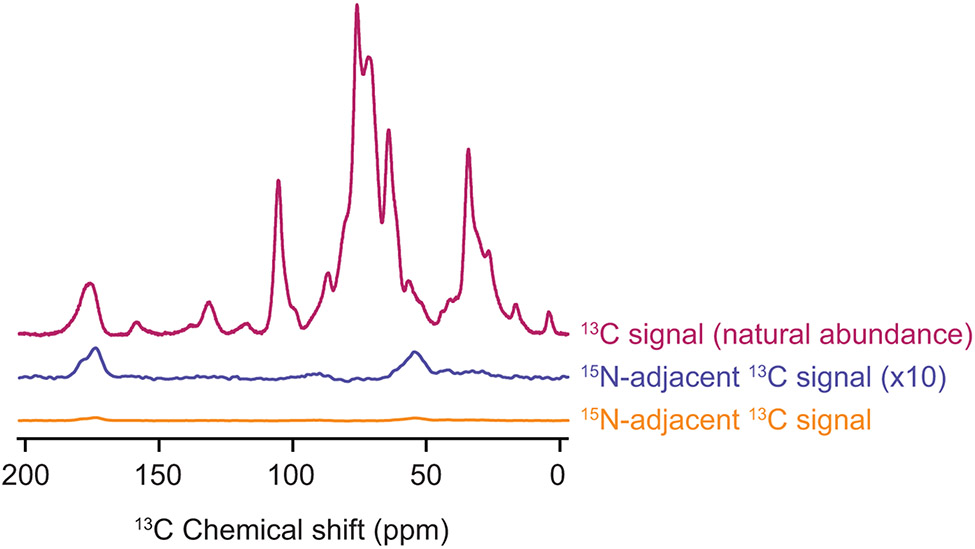
Figure 5:
The combination of isotopic depletion of the cellular lysates with spectroscopic selection for adjacent isotopically labeled sites enables highly specific detection of proteins at endogenous concentrations. One dimensional 13C{1H} CP spectra report on all of the 13C in the sample (magenta). The TEDOR experiment with a 1.6 ms mixing time (orange) is selective for 13C sites with adjacent 15N atoms. Such sites are much less common (see Table 1) than 13C sites overall. The TEDOR spectra (orange) is multiplied by a factor of 4 to account for differences in experimental efficiency between the 13C CP experiment (magenta) and the TEDOR experiment (orange). It is further multiplied by a factor of 10 (blue) to allow comparison of the difference in features of the peak that reports on the carbonyl carbon chemical shift around 175 ppm. The peak near 175 ppm in the TEDOR spectra is shifted towards values that are consistent with beta sheet conformations and has a shoulder near 180 ppm, in line with the amino acid composition of the protein. Specificity for the 1 μM concentration of added protein from the cellular background can be obtained for samples of per-deuterated cellular lysates in a 60:30:10 mixtures of d8-glycerol:D2O:H2O and 10 mM AMUPol at 600 MHz/385 GHz with ω/2π = 12.5 kHz and a sample temperature of 100 K.

