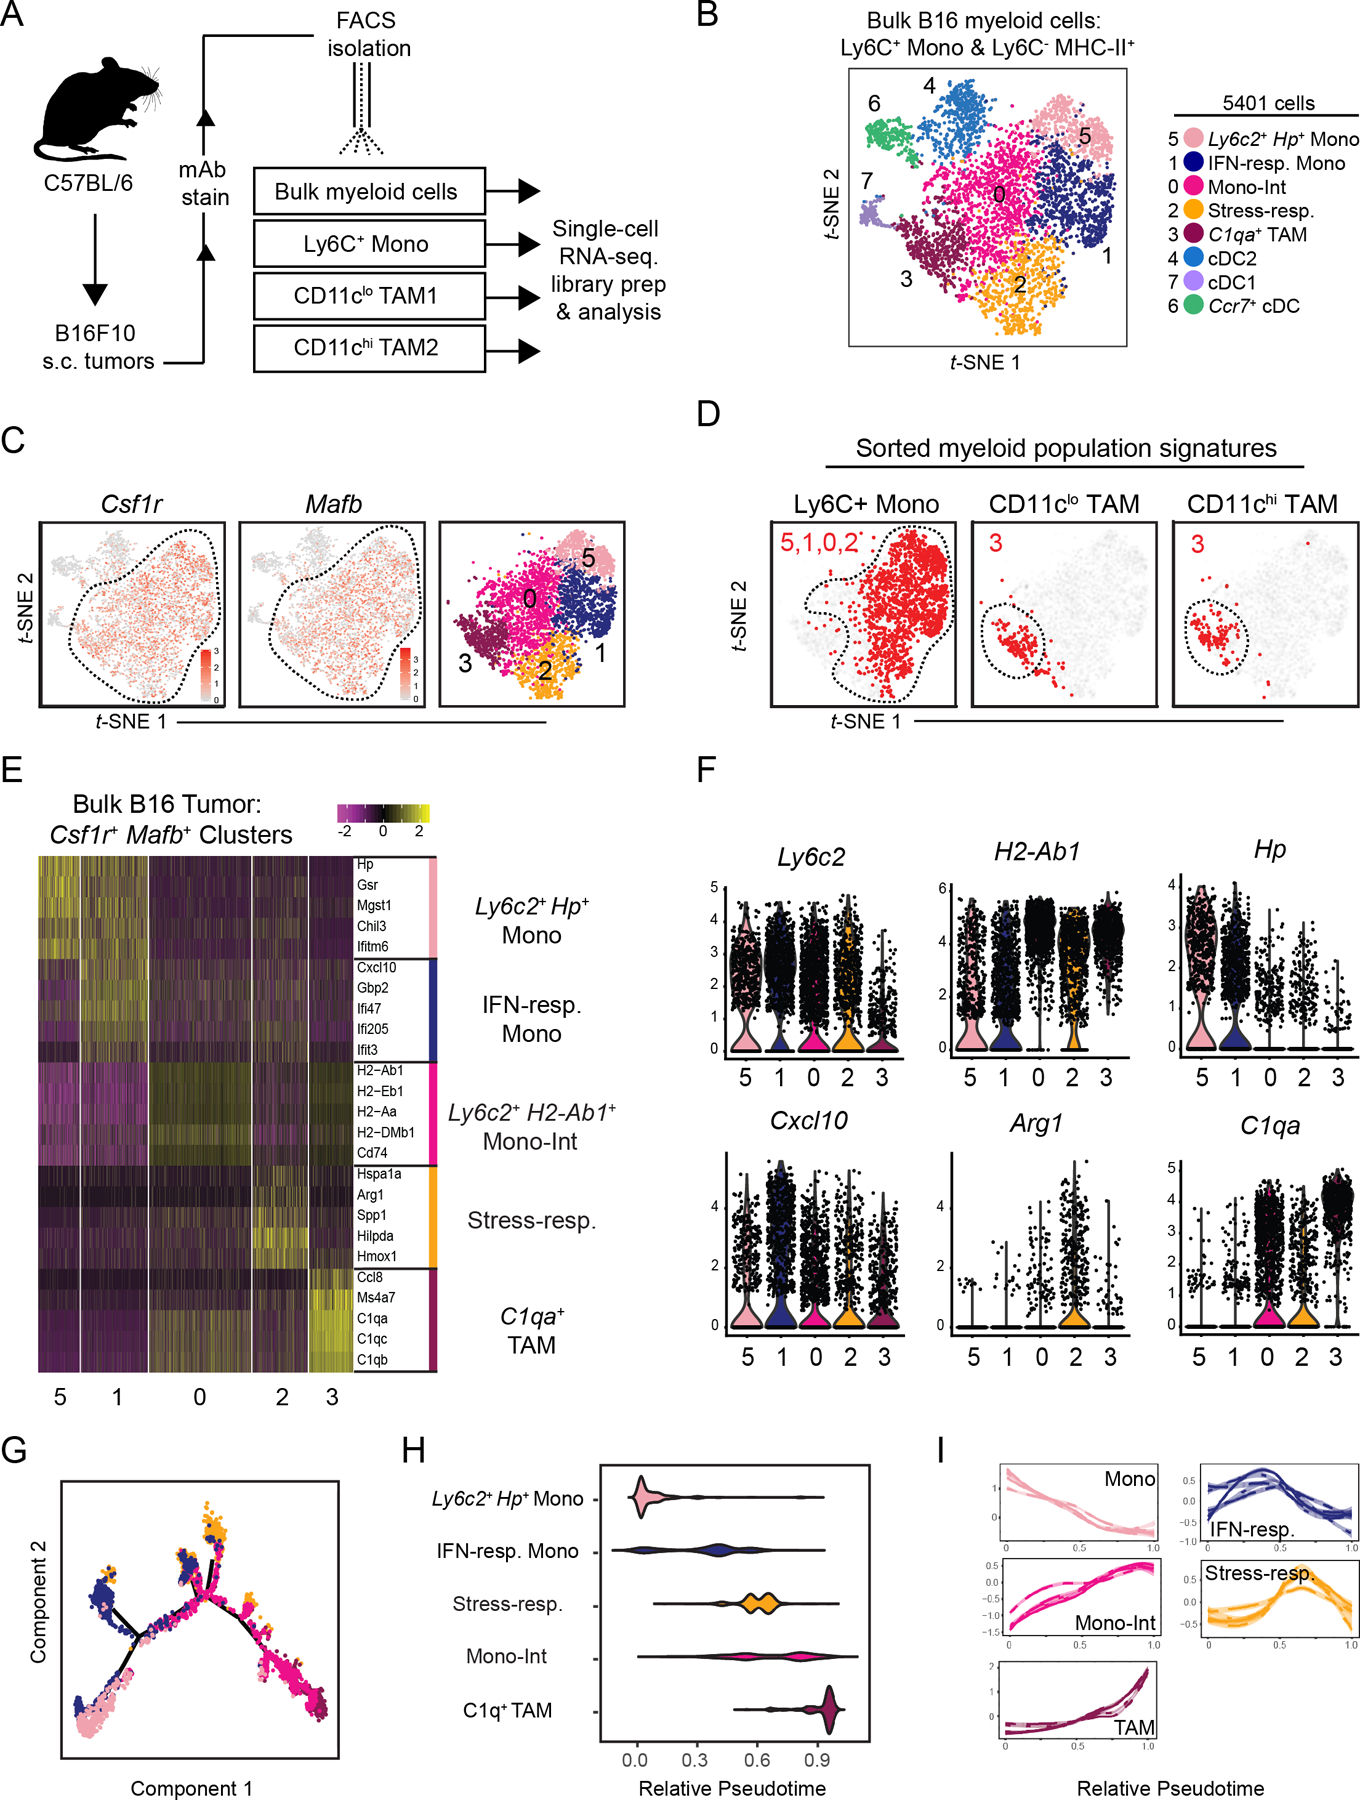
Figure 1. ScRNA-seq analysis of mouse B16 tumor myeloid cells maps transcriptional heterogeneity amongst monocytes and TAMs.

(A) Schematic illustration of workflow for isolation of specified myeloid cell populations from B16 tumors subcutaneously implanted in wild-type C57Bl/6 mice.
(B) t-SNE plot of graph-based clustering of Ly6C+CD11b+ monocytes and Ly6C–MHCII+ myeloid cells that were sorted and pooled from at least 5 B16 tumors, and underwent scRNA-seq (A). Each dot represents a single cell.
(C) Expression of Csf1r (left) and Mafb (middle) on t-SNE plot of bulk myeloid cells (B), and display of selected Csf1r+Mafb+ clusters (right).
(D) Expression of gene signatures specific to Ly6C+ monocyte, CD11clo TAM1, or CD11chi TAM2 populations (A, Supplementary Fig. S1F) displayed on t-SNE plot of Csf1r+Mafb+ myeloid cells (C). Cells with top median of signature expression level labeled in red.
(E) Heatmap displaying expression levels of top 5 DE genes between Csf1r+Mafb+ cell clusters (C). Genes ranked by fold change.
(F) Expression levels of selected genes amongst Csf1r+Mafb+ cell clusters (C).
(G) Differentiation trajectory model using Monocle analysis of cells from Csf1r+Mafb+ clusters (C). Color coding corresponds to previous labels (B).
(H) Graph of relative pseudotime values of Csf1r+Mafb+ cluster cells (C) from Monocle analysis (G).
(I) Expression levels of cluster-specific genes (E) over relative pseudotime (H). Each line corresponds to an individual gene.
