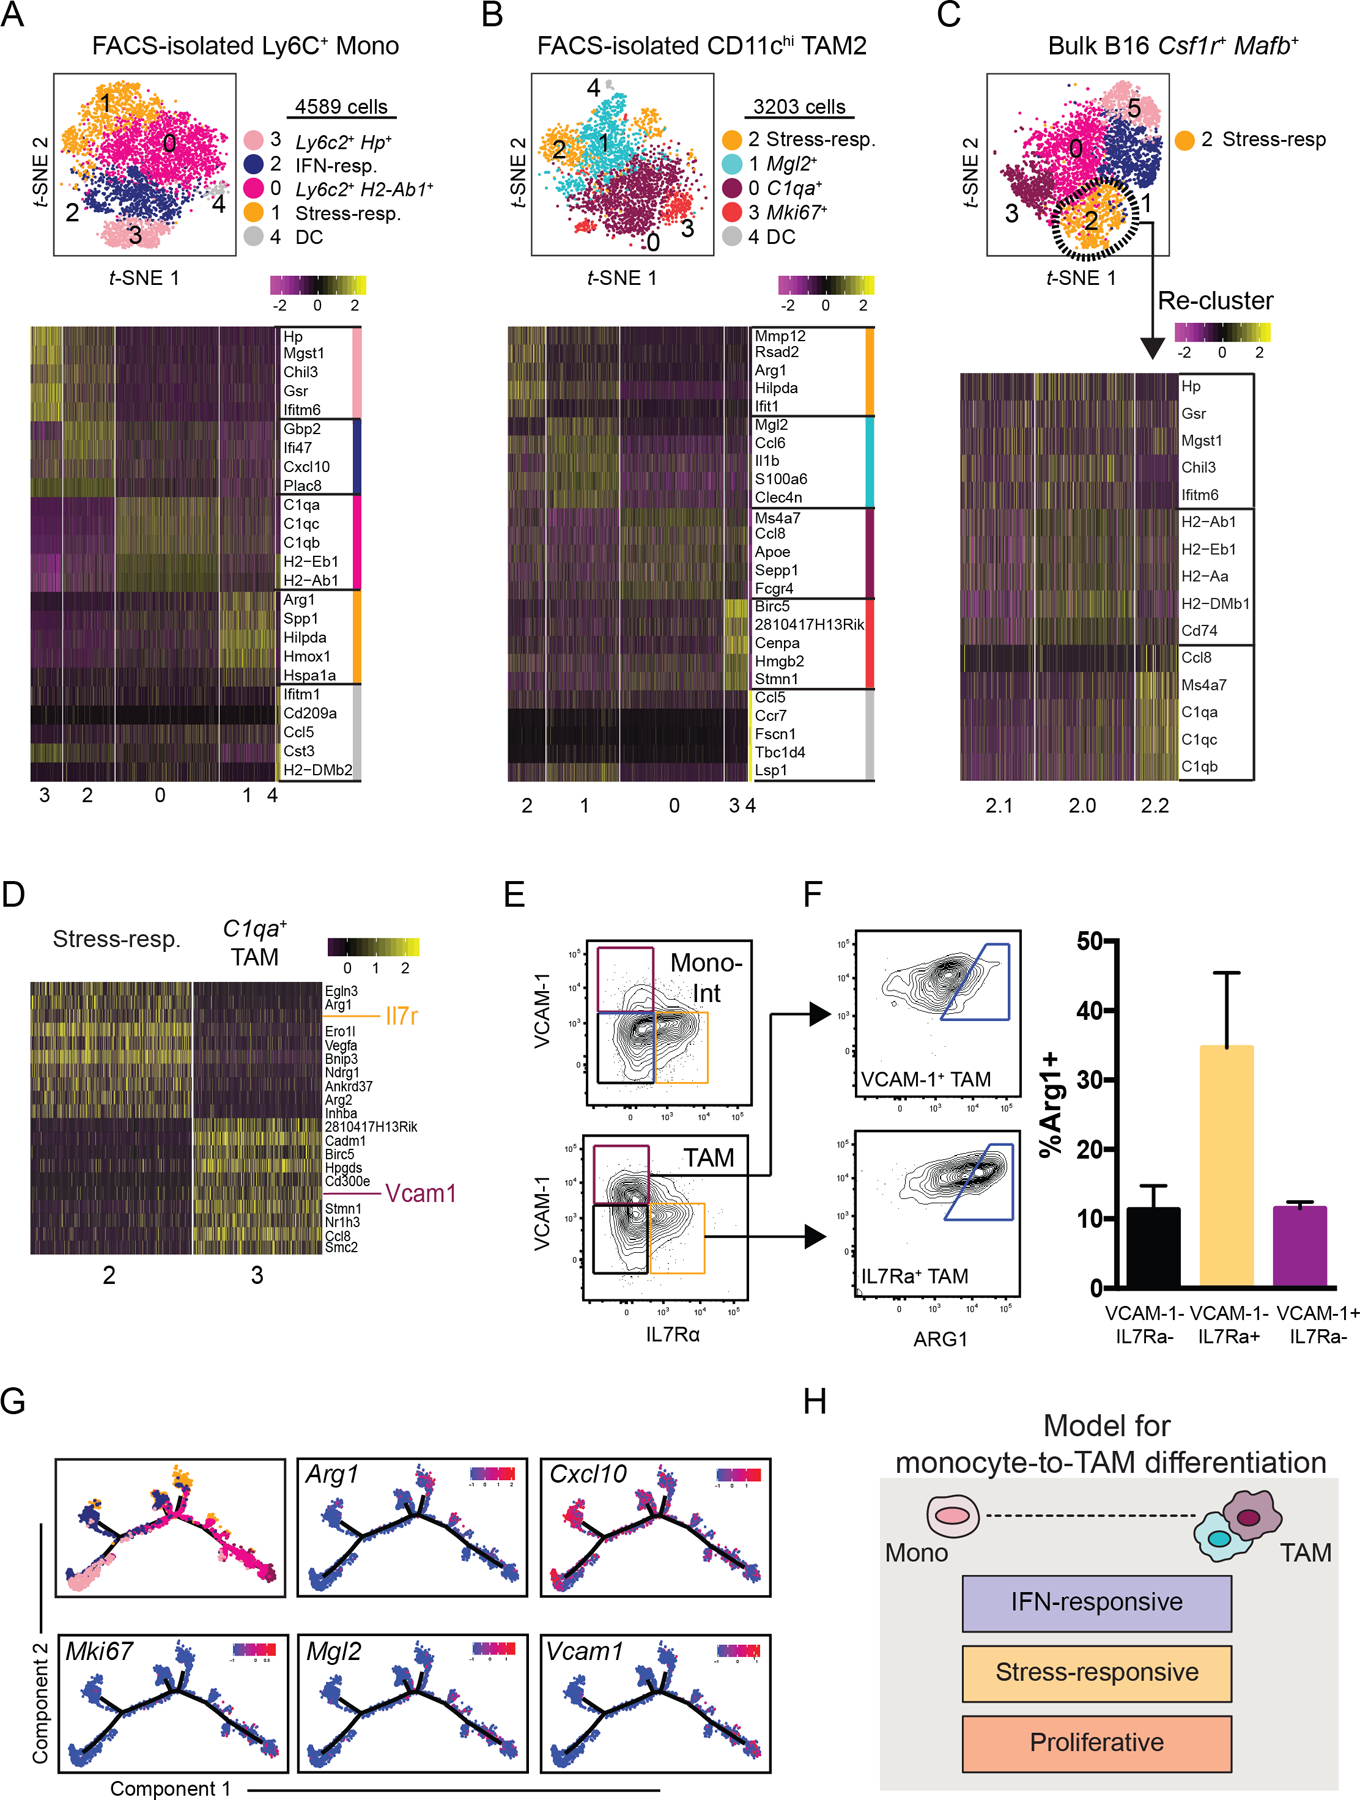
Figure 2. ScRNA-seq analysis highlights layering of microenvironment-induced programs during tumor monocyte-to-macrophage differentiation.

(A) t-SNE plot of graph-based clustering (top) of Ly6C+ monocytes sorted from B16 tumors and processed for scRNA-seq (Fig. 1A), and heatmap displaying expression levels of top 5 DE genes between clusters (bottom) with genes ranked by fold change.
(B) t-SNE plot and graph-based clustering (top) of CD11chi TAMs sorted from B16 tumors and processed for scRNA-seq (Fig 1A), and heatmap displaying expression levels of top 5 DE genes between clusters (bottom) with genes ranked by fold change.
(C) Stress-responsive cells (Cluster 2) from bulk B16 myeloid cells (Fig. 1B) were selected for further clustering analysis (top). Heatmap of expression levels of monocyte- and macrophage-specific genes (Fig. 1E) by Cluster 2 sub-cluster (bottom).
(D) Heatmap of DE gene expression levels between Cluster 2 and Cluster 3 of bulk tumor myeloid cell sample (Fig. 1B). Genes ranked by degree of exclusivity to a given cluster (min.pct1/min.pct2).
(E) Expression levels of IL7Rα and VCAM-1, as assessed by flow cytometry, of “Mono-Int” (Ly6C+CD64+) (top) and TAMs (Ly6C–F4/80+CD64+) (bottom) from B16 tumors.
(F) Example (left) and quantification (right) of intracellular ARG1 expression by VCAM-1+ (top) or IL7rα+ (bottom) TAMs from B16 tumors using flow cytometry. ARG1+ gating determined by isotype control. Data are representative of 2 independent experiments with 3–5 mice per experiment (mean ± SEM).
(G) Expression levels of selected genes along differentiated trajectory generated by Monocle (Fig. 1G).
(H) Schematic model of tumor monocyte-to-macrophage differentiation that integrates lineage-associated and microenvironmentally-induced transcriptional programs.
