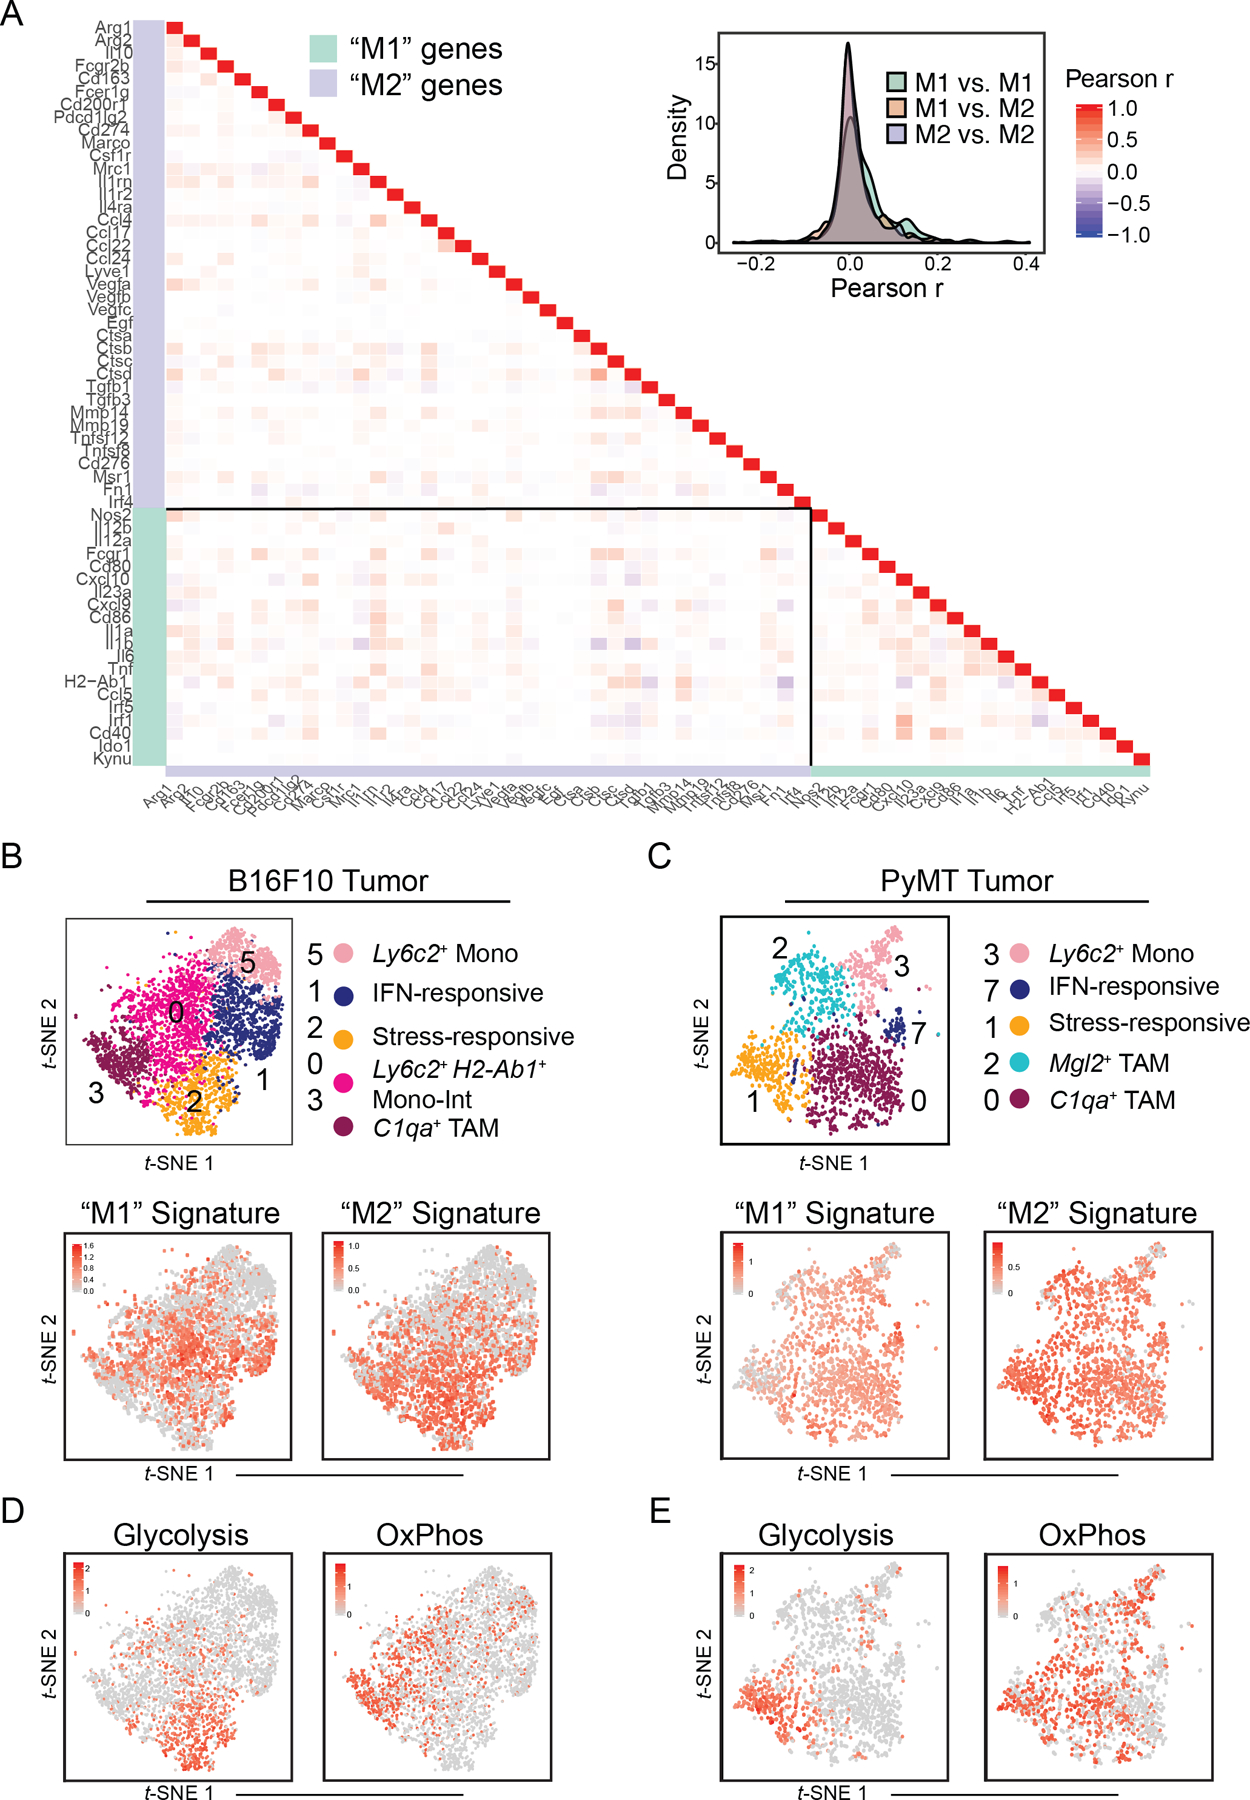
Figure 3. B16 and PyMT tumor monocyte–macrophage heterogeneity can be attributed to diversity in transcriptional and metabolic programs, but not “M1/M2” polarization.

(A) Heatmap (left) and density plot (right) of Pearson r coefficient scores between “M1”- and “M2”-associated gene expression levels within Csf1r+Mafb+ cells from B16 tumors (Fig. 1C).
(B) t-SNE plot of Csf1r+Mafb+ clusters from B16 tumors (top; Fig. 1C) with expression levels of “M1” (bottom, left) and “M2” (bottom, right) gene signatures (A) displayed. Cells with top median of signature expression level labeled in red.
(C) t-SNE plot and graph-based clustering of Csf1r+Mafb+ clusters of myeloid cells that were sorted from 1 PyMT tumor and processed for scRNA-seq in an independent experiment (top; Supplementary Fig. 3B). Expression levels of “M1” (bottom, left) and “M2” (bottom, right) gene signatures (A) displayed. Cells with top 70 percentile of signature expression level labeled in red.
(D) Expression levels of glycolysis (left) and oxidative phosphorylation (“OxPhos”) (right) gene signatures (Supplementary Fig. 3F) displayed on t-SNE plot of Csf1r+Mafb+ clusters from B16 tumors (Fig. 1C). Cells with top 70 percentile of signature expression level labeled in red.
(E) Expression levels of glycolysis (left) and oxidative phosphorylation (“OxPhos”) (right) gene signatures (Supplementary Fig. 3F) displayed on t-SNE plot of Csf1r+Mafb+ clusters from PyMT tumors (C). Cells with top 70 percentile of signature expression level labeled in red.
