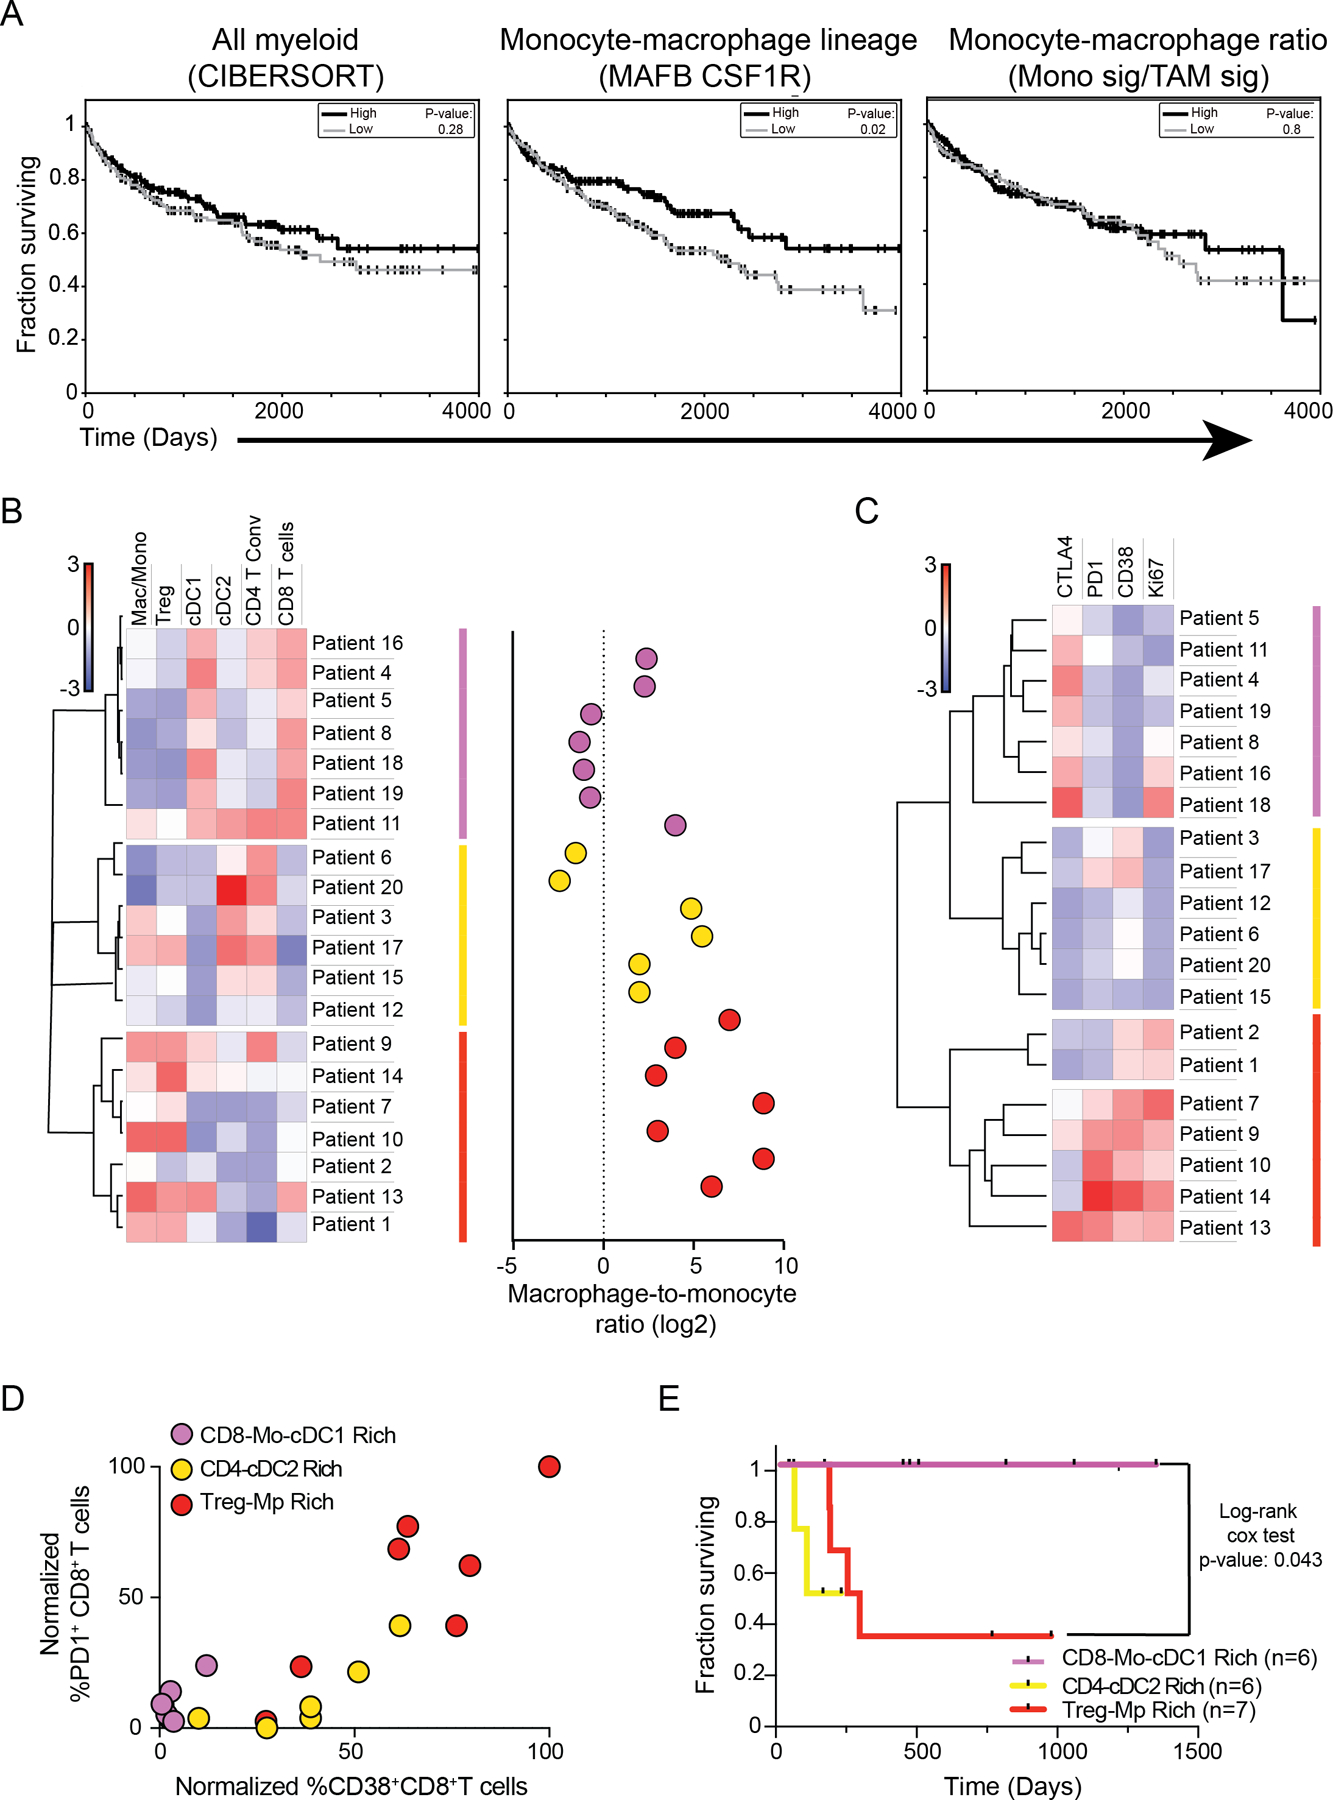
Figure 6. Multiparametric analysis of tumor myeloid composition identifies kidney cancer patients with effector CD8+ T-cell responses and improved survival rates.

(A) Survival curves of kidney tumor patients whose TCGA tumor samples exhibited high (33%) or low (33%) levels of expression levels of pan-myeloid cell gene signatures derived from CIBERSORT (left), MAFB and CSF1R (middle), or ratio of monocyte-to-TAM gene signatures (Fig. 4) (right), analyzed with log-rank test.
(B) Heatmap of specified immune cell population frequencies (left) and the ratio of macrophage-to-monocytes (right) detected in 20 human kidney tumor samples by flow cytometry.
(C) Heatmap of specified surface receptor or Ki-67 expression frequencies amongst CD8+ T cells from 20 human kidney tumor samples that were analyzed with flow cytometry.
(D) Quantification of the frequency of CD8+ T cells from 20 human tumor kidney samples that are PD1+ or CD38+. Labeling of dots corresponds to patient groups (B,C).
(E) Survival curves of kidney cancer patients in cohort analyzed with log-rank test (B-D).
