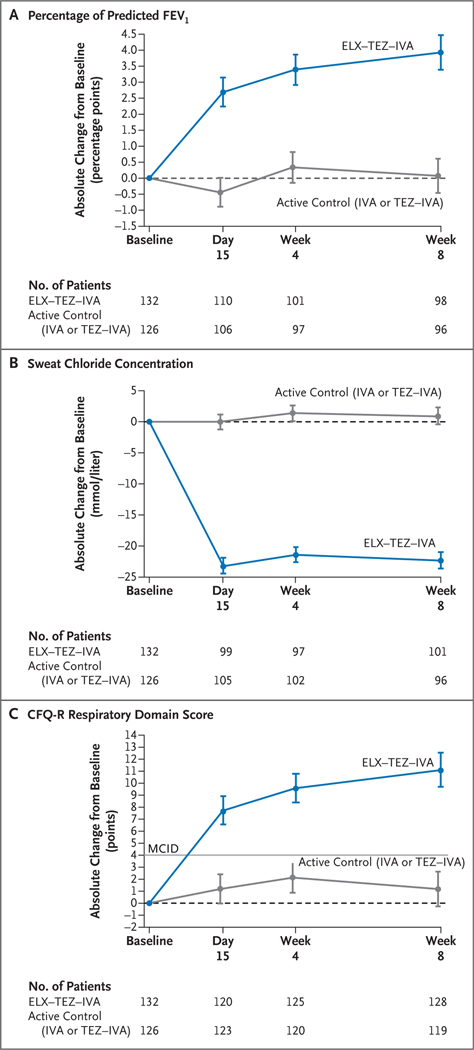
Figure 1. Efficacy End Points.
Panel A shows the absolute change from baseline at each visit in the percentage of predicted forced expiratory volume in 1 second (FEV1) on the basis of a mixed-effects model for repeated measures. Panel B shows the absolute change from baseline at each visit in the sweat chloride concentration on the basis of a mixed-effects model for repeated measures. Panel C shows the absolute change from baseline at each visit in the score on the respiratory domain of the Cystic Fibrosis Questionnaire–Revised (CFQ-R) on the basis of a mixed-effects model for repeated measures. Respiratory domain scores are normalized to a 100-point range, with higher scores indicating a higher patient-reported quality of life with regard to respiratory symptoms; the minimal clinically important difference (MCID) is 4 points and is indicated in the plot by the straight gray line. In Panels A through C, data are least-squares means, and the I bars indicate standard errors; the dashed line at 0 cor responds to no change from baseline. The sample size shown under each x axis is the number of patients at that time point with data that could be evaluated. ELX–TEZ–IVA denotes elexacaftor–tezacaftor–ivacaftor, IVA ivacaftor, and TEZ–IVA tezacaftor–ivacaftor.

