. 2022 Mar 7;12(12):7485–7496. doi: 10.1039/d2ra00392a

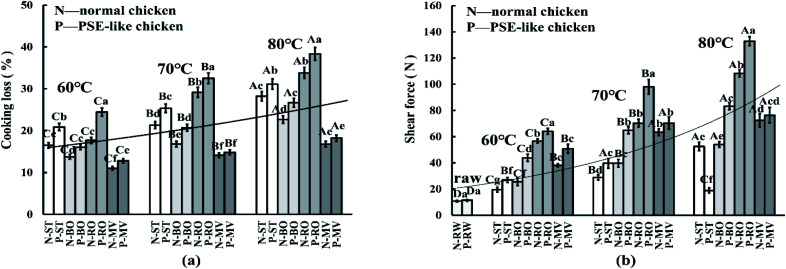
Fig. 2. The cooking loss (a), shear force value (b) of PSE-like and normal chicken breast after cooking by roasting (RO), microwaving (MV), steaming (ST) and boiling (BO) at core temperature of 60, 70 and 80 °C. (RW) indicated raw meat, (N) indicated normal chicken breast, and (P) indicated PSE-like chicken breast. Capital letters indicated that there were significant differences between treatment groups with different core temperatures under the same cooking method (p < 0.05). The lowercase letters indicated that there were significant differences between treatment groups with different cooking methods at the same core temperature (p < 0.05).

Fig. 2