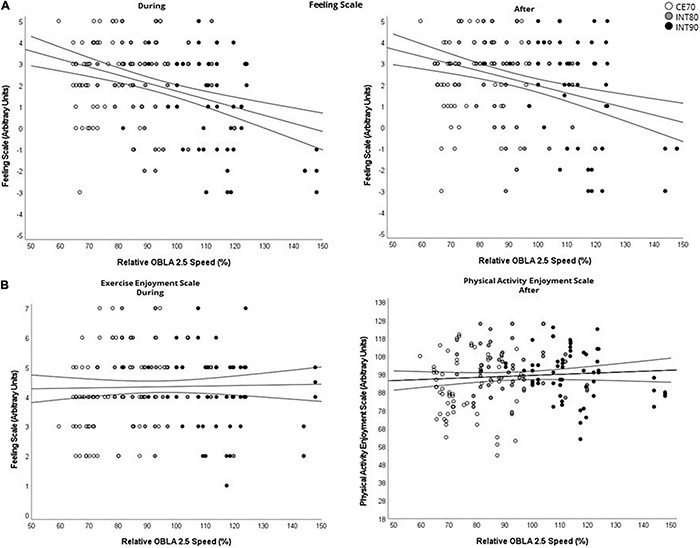
FIGURE 5.

Scatter plots illustrating the relationship between relative OBLA 2.5 running speed across all exercise sessions and weeks (n = 180) and (A) all FS scores; significant correlation for Feeling Scale during- (Relative OBLA 2.5 Speed: r = –0.36, p < 0.01) and after the exercise sessions (Relative OBLA 2.5 Speed: r = –0.32, p < 0.01), (B) all PACES and EES scores; no significant correlations. Trend line for regression and 95% CI. OBLA, onset of blood lactate accumulation; CI, confidence interval; FS, feeling scale; PACES, physical activity enjoyment scale; EES, exercise enjoyment scale; RPE, rating of perceived exertion.
