
Figure 7.
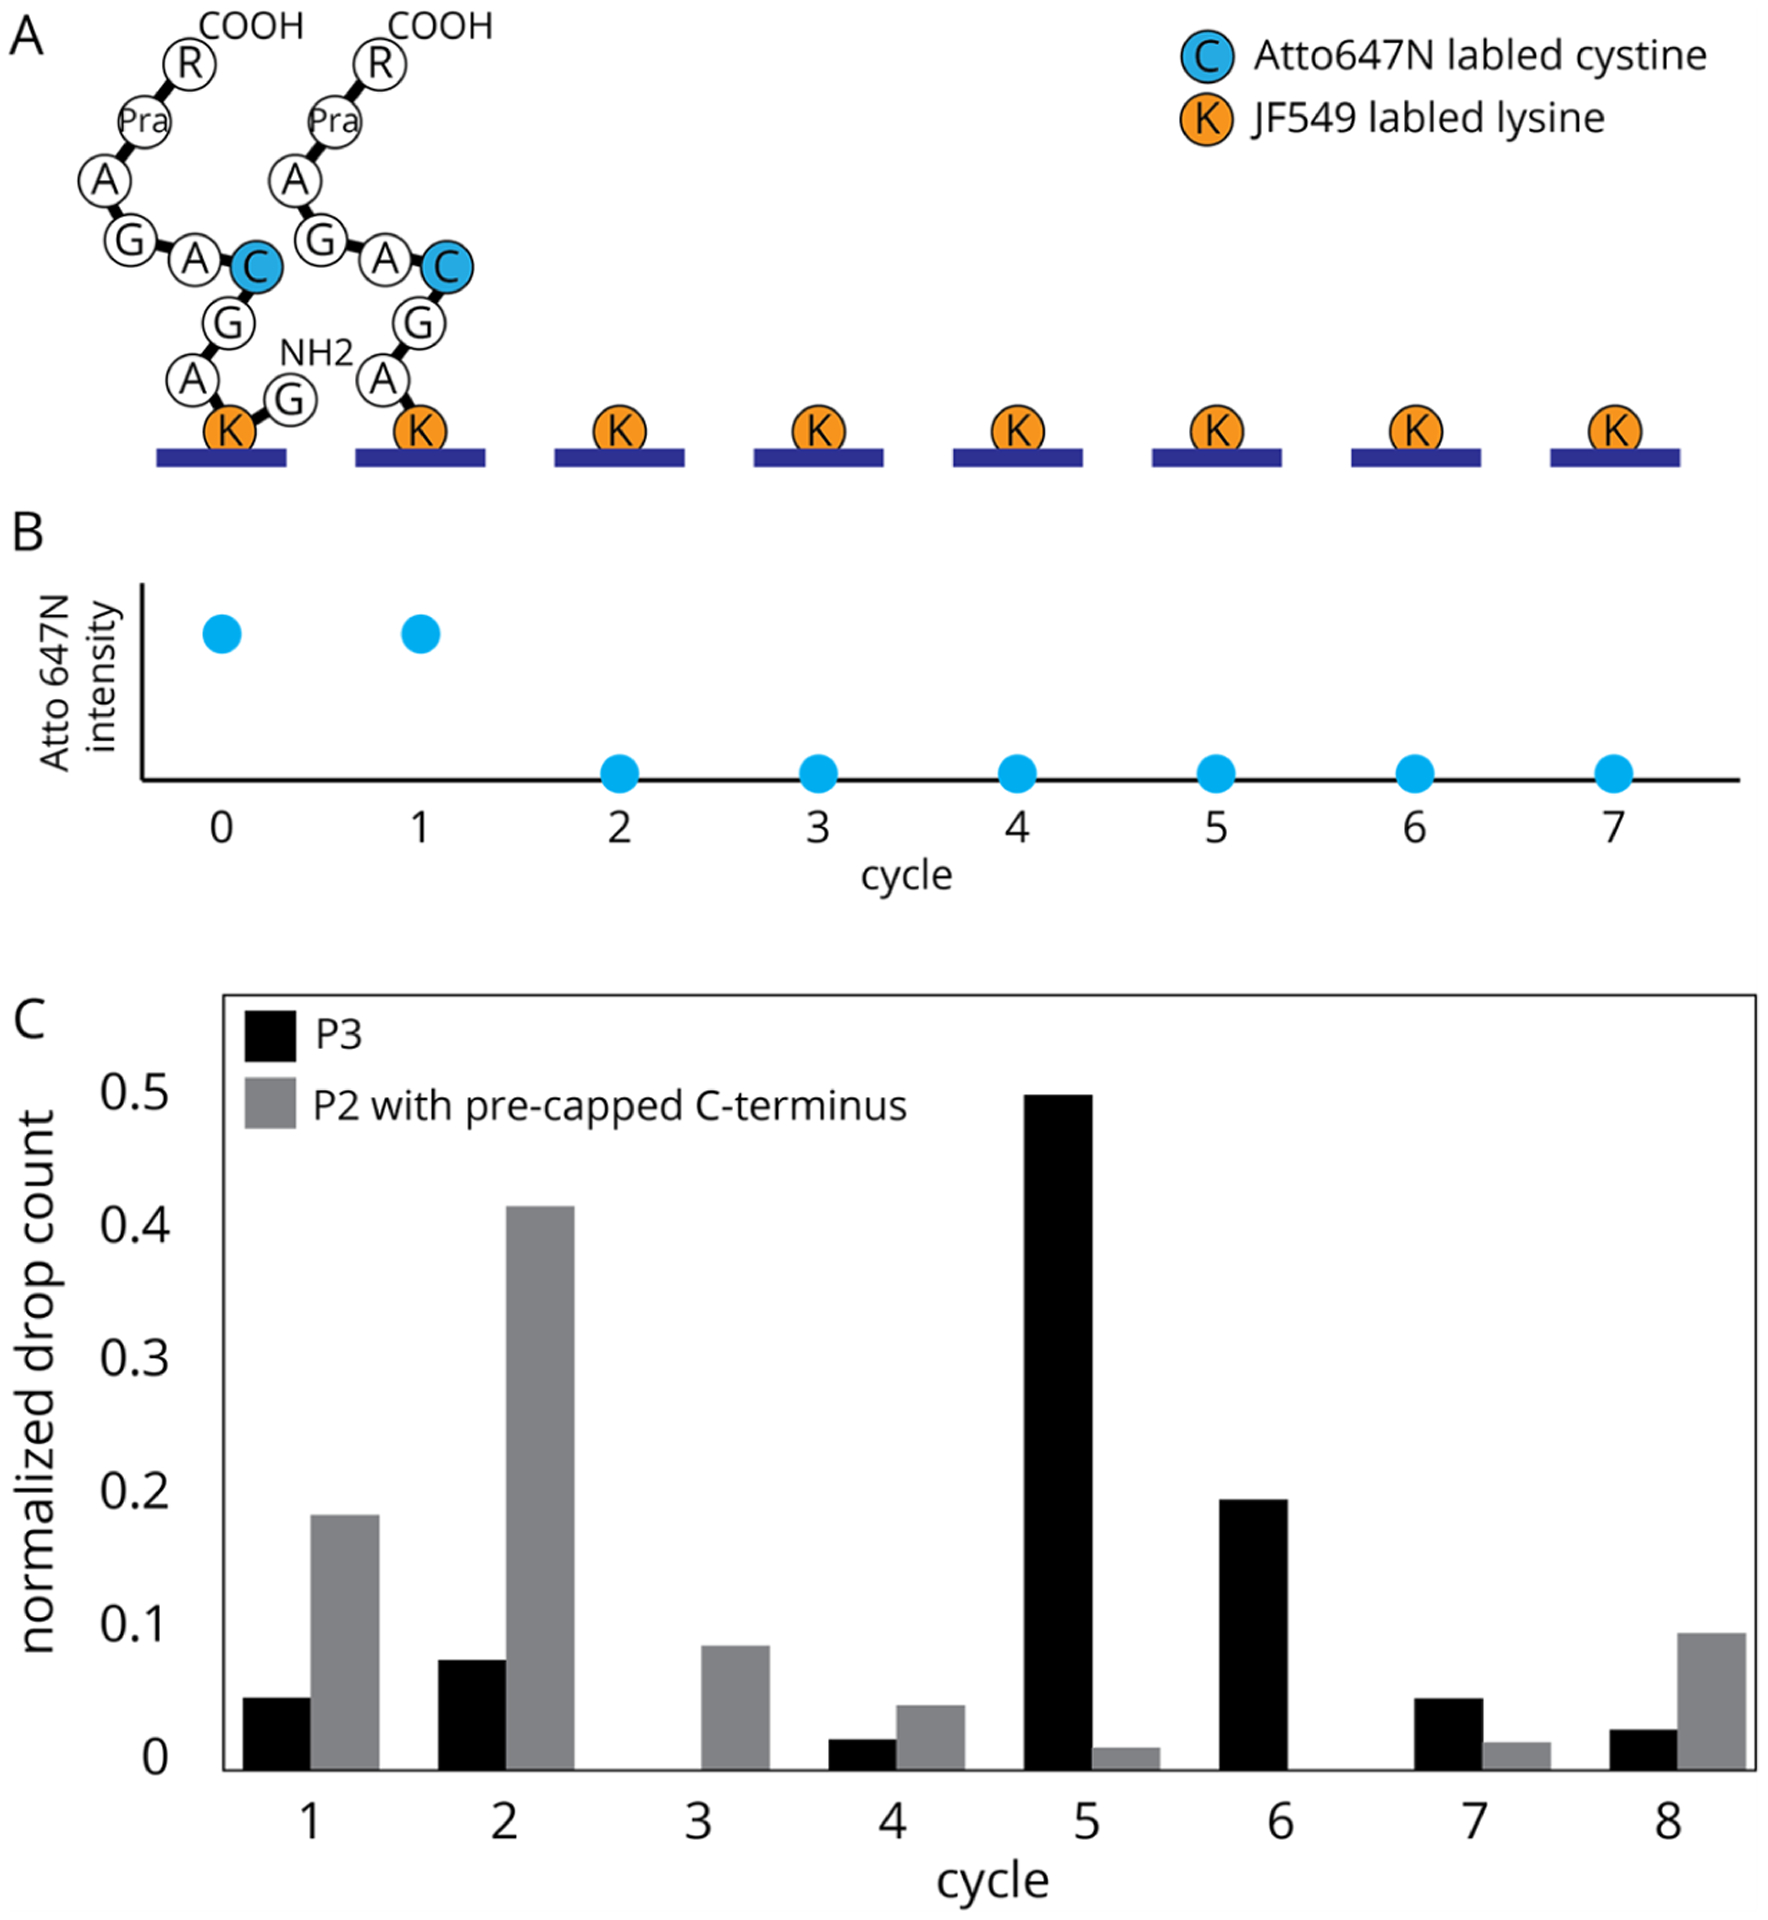
(A) Expected sequence changes of a single P2 peptide misattached though the JF549 dye after rounds of Edman degradation. (B) Relative fluorescence changes expected for Atto647N on peptide P2 misattached via JF549, where signal loss is correlated to the liberation of the remaining peptide after Edman degradation at the labeled lysine. (C) Fluorosequencing of control peptide P3, with no JF549 label, results in mostly C-terminal attachment and a peak drop count after the fifth Edman cycle (n = 2304). Fluorosequencing results for P2 in which the C-terminus was capped prior to attachment to the surface, thus resulting in mostly attachment though the JF549, shows a prominent peak drop count after the second Edman cycle (n = 1380).