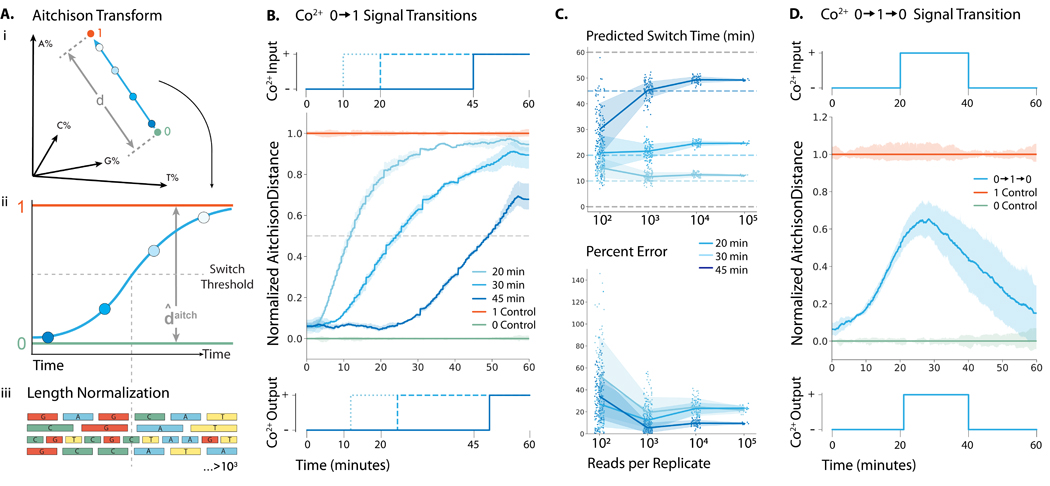
Figure 2: Recording Co2+ fluctuations into ssDNA with minutes resolution in vitro.

(A-i) Representation of how the percent incorporation of each nucleotide is dependent on each of the nucleotides incorporated. (A-ii) By transforming the percent incorporation of each nucleotide to the Aitchison distance, we can calculate the total “output signal”. (A-iii.) Sequences were normalized by length before the nucleotide composition at each time point was calculated. We plot the Aitchison distance for the recording experiment between the 0 (green) and 1 (orange) signals. (B) (top) 0.25 mM Co2+ was added at 10, 20, and 40 min to generate a transition. (center) Mean output signal across three biological replicates. Vertical lines are drawn at the inferred transition time. (bottom) Predicted output signal transition times were 11.9, 24.4, and 49.2 min. (C) (top) Predicted switch times for each transition calculated from randomly sampled subsets of sequences. (bottom) Time prediction error for each transition calculated from randomly sampled subsets of sequences. (D) (top) 0.25 mM Co2+ was added at 20 min and then removed at 40 min to generate a transition. (center) Mean output signal across three biological replicates. (bottom) Using the algorithm detailed by Glaser et al., (13) the signal was deconvoluted into a binary response, with vertical lines drawn at the predicted switch times of 21 and 41 min.
