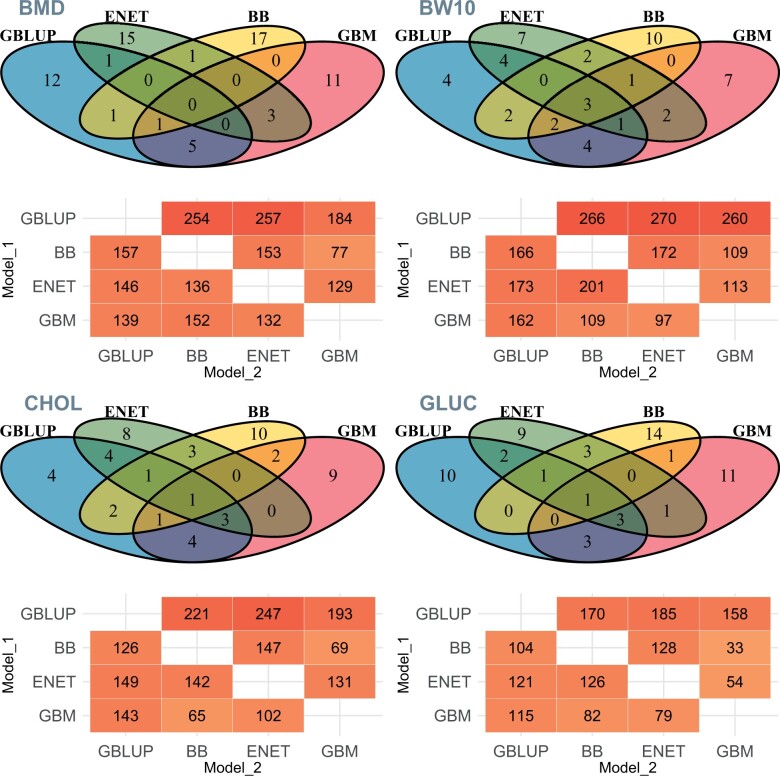
Fig. 5.
Venn diagrams showing the unique animals among the top 20 (above) predicted values (10% of the validation subset) between models and the number of SNP markers in common or in high LD (r2 > 0.90) among the top 1,000 SNP (below) from GBLUP, BayesB (BB), ENET, and GBM for BMD, BW10, CHOL, and GLUC. Values represent the overlap of SNP when Model_1 (y-axis) is considered as reference. Traits: BMD, BW10, CHOL, and GLUC.

