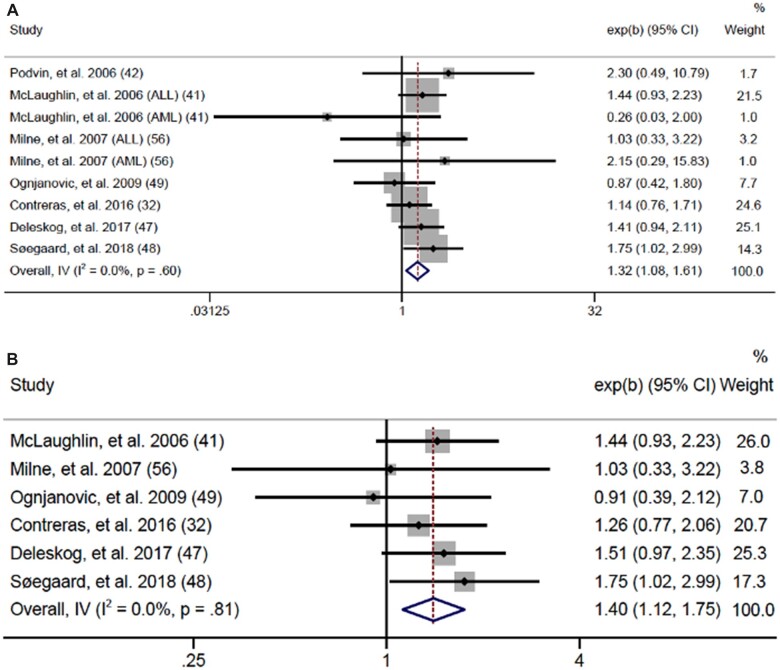
Figure 6.
Forest plots: meta-analysis of the association between gestational diabetes and risk of (A) any leukemia and (B) acute lymphoblastic leukemia. The error bars represent the 95% confidence intervals (CIs). Fixed effects models (inverse variance method) were used for statistical analyses. Tests were 2-sided. ALL = acute lymphoblastic leukemia; AML = acute myeloid leukemia; IV = inverse variance.

