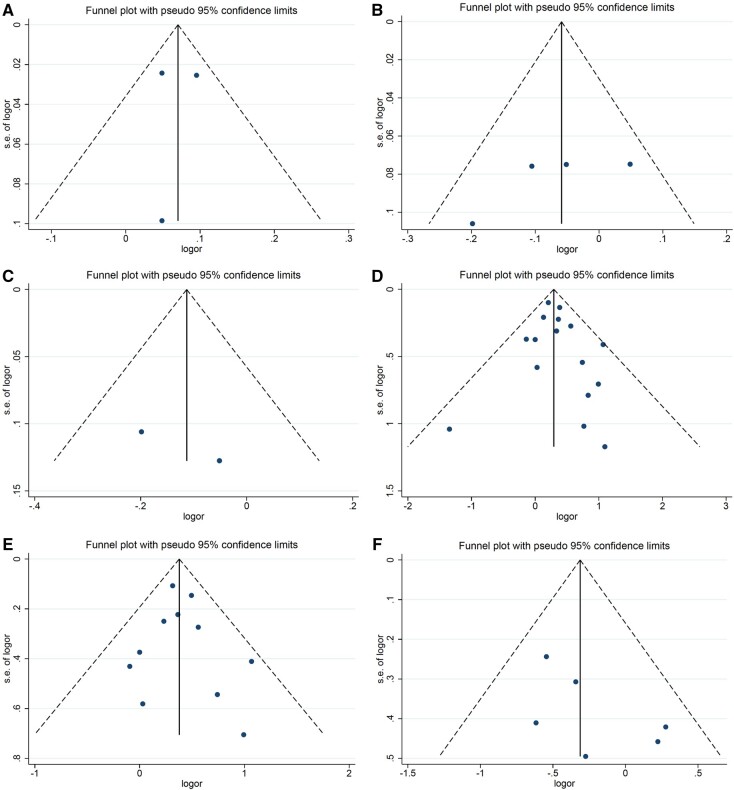
Figure 8.
Funnel plots for meta-analysis results of the associations between prepregnancy BMI, maternal diabetes, and gestational weight gain and risk of pediatric cancers. A) Funnel plot for the association between prepregnancy BMI and risk of any leukemia; (B) funnel plot for the association between prepregnancy BMI and risk of central nervous system tumors; (C) funnel plot for the association between prepregnancy BMI and risk of embryonal central nervous system tumors; (D) funnel plot for the association between any diabetes and risk of any leukemia; (E) funnel plot for the association between any diabetes and risk of acute lymphoblastic leukemia; (F) funnel plot for the association between any diabetes and risk of central nervous system tumors; (G) funnel plot for the association between any diabetes and risk of lymphoma; (H) funnel plot for the association between any diabetes and Wilms tumor risk; (I) funnel plot for the association between pregestational diabetes and risk of any leukemia; (J) funnel plot for the association between pregestational diabetes and risk of acute lymphoblastic leukemia; (K) funnel plot for the association between gestational diabetes and risk of any leukemia; (L) funnel plot for the association between gestational diabetes and risk of acute lymphoblastic leukemia; (M) funnel plot for the association between inadequate gestational weight gain and risk of central nervous system tumors. BMI = body mass index; logor = natural log of the odds ratio; s.e. = standard error.

