. 2022 Mar 15;12(13):8193–8201. doi: 10.1039/d2ra00889k

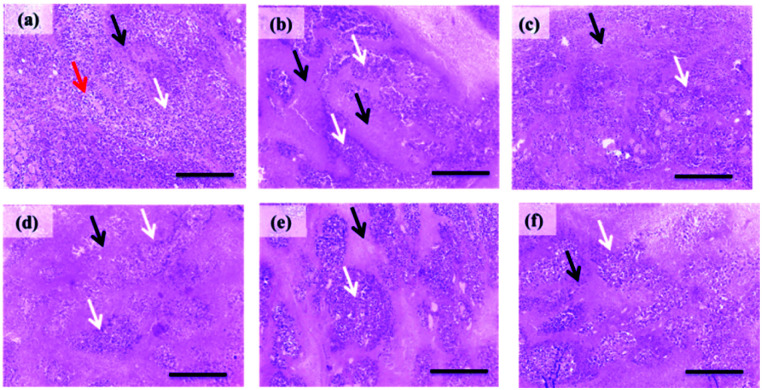
Fig. 6. Histopathological pictures of stained EAT tissues with H & E (×100). (a) Section obtained from EAT control group showing numerous large, rounded, and polygonal stained tumor cells (white arrow) aggregated around newly formed blood capillaries (red arrows) innervated by small necrotic areas (black arrow). (b) Section obtained EAT group treated with 5e at 2.5 mg kg−1 showing a mild increase of necrotic areas (black arrow). (c) Section obtained from EAT group treated by 5 mg kg−1 of 5e showing severe necrosis (black arrow) and an apparent reduction in viable areas (white arrows). (d) Section obtained from EAT mice treated with 5d (2.5 mg kg−1) showing a moderate decrease in the size of viable areas (white arrows). (e) Section obtained from EAT mice treated with 5d (5 mg kg−1) showing moderate diffuse necrosis (black arrows). (f) Section from doxorubicin-treated group showing a marked decrease of viable areas (white arrows) and an increase of necrotic areas (black arrows).

Fig. 6