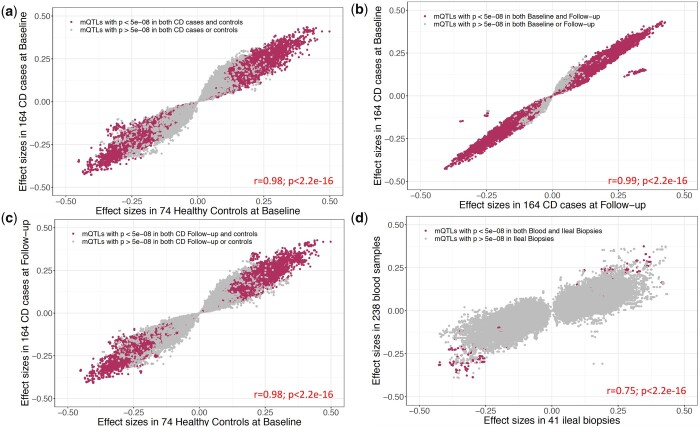
Fig. 3.
Disease-, disease course-, or tissue-specific associations in discovery cohort. For 498,261 cis-SNP-CpG pairs significant in the discovery cohort of 238 blood samples, Figure 3 shows effect sizes estimated in the following subgroups: a) 74 healthy controls vs 164 CD cases at diagnosis, (b) 164 CD cases at diagnosis v. their 3-year follow-up, (c) 74 healthy controls at baseline vs 164 CD cases at follow-up, and (d) all 238 blood samples vs 40 ileal biopsies. Maroon color indicates the associations that are significant (P < 5 × 10⁻⁸) in both subgroups. Gray indicates the associations that are significant in 1 subgroup but not the other.

