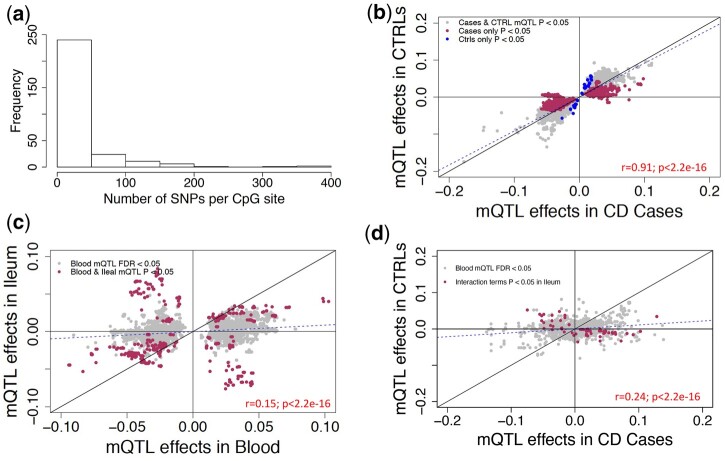
Fig. 5.
Testing the effects of CD-associated CpG sites in blood and ileum. a) Frequency of SNPs that are associated with CD-associated CpG sites in discovery cohort at FDR < 0.05 are plotted. In total, 7,819 associations with 289 CD-associated CpG sites are considered. b) Effect sizes of 7,819 SNP-CpG associations compared in cases vs controls in blood. The x-axis shows the effect sizes in CD cases (n = 164) and y-axis shows the effect sizes for the same associations in controls (n = 74) (c) Effect sizes of 6,221 SNP-CpG associations from blood are compared to effect sizes observed in ileum. Associations nominally significant in ileum (P < 0.05) are marked in maroon. d) Effect sizes of 4,142 SNP-CpG associations compared in cases vs controls in ileum. x-axis shows effect sizes in CD cases (n = 17) and y-axis shows effect sizes for the same associations in controls (n = 23). Maroon points indicate nominally significant (P < 0.05) interactions between SNP and disease group, suggesting differences in strength and/or direction of SNP-CpG association for cases vs controls.

