Fig. 2.
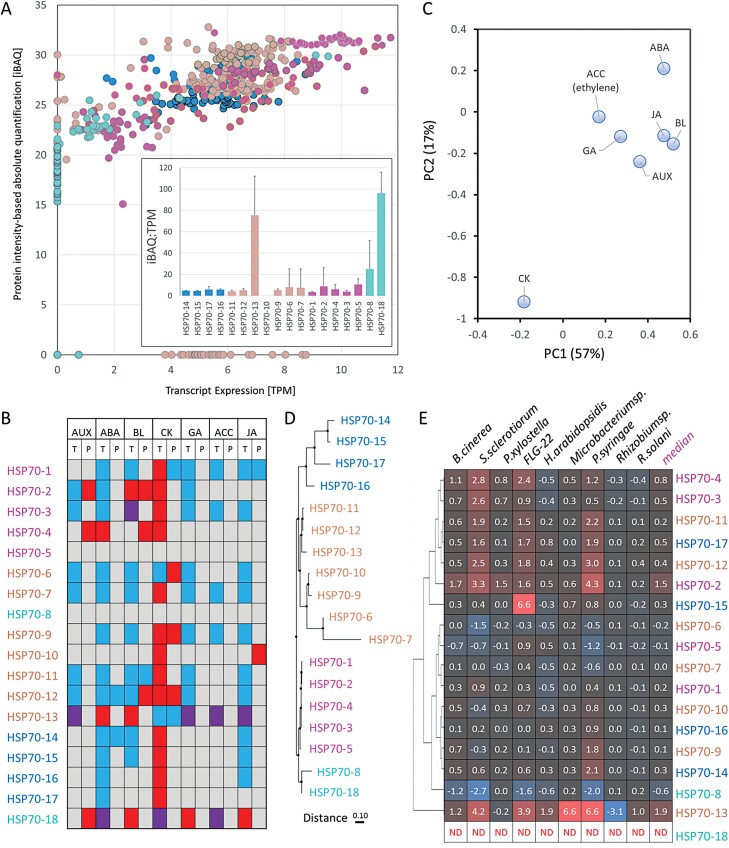
Transcriptional and translational control of HSP70. (A) Gene expression and estimated protein abundance of HSP70s in Arabidopsis. Comparison of available profiles across a set of 30 matching tissues from the Arabidopsis tissue atlas (Mergner et al., 2020). The inset plot represents the average protein:transcript ratio with the SD. (B) Phytohormones regulate HSP70 biosynthesis. Simplified heat map visualization of reported transcriptional (T; ThaleMine; Krishnakumar et al., 2017) and protein (P; Černý et al., 2016) response to phytohormones. (C) Principal component analysis of the data in (B). Red, up-regulation/increase in protein abundance; blue, down-regulation, decrease in protein abundance; purple, mixed response; AUX, auxin; ABA, abscisic acid; BL, brassinosteroid; CK, cytokinin; GA, gibberellin; ACC, ethylene precursor; JA, jasmonate. (D) Sequence feature similarity visualized by Jalview (Waterhouse et al., 2009) and (E) Arabidopsis HSP70 genes in response to biotic interaction and flagellin peptide fragment (FLG-22; elicits defense response). The ratio represents the median log2 expression compared with mock-treated plants. Expression data were retrieved from the Arabidopsis RNA-Seq Database (Zhang et al., 2020).

