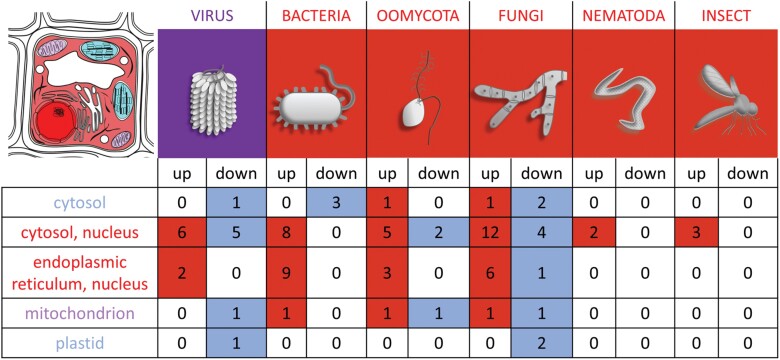
Fig. 5.
Comparison of the HSP70 response to biotic stress and its localization. Summary of reported transcriptomic and protein analyses outlined in Fig. 4B and Table 2. Localization is based on the expected localization of Arabidopsis HSP70s and corresponding putative Arabidopsis orthologs. The color of the cellular compartments represents the predominant response of the resident HSP70s to biotic stimuli. Red, blue, and purple represent a positive, negative, and mixed response to biotic stimuli, respectively.

