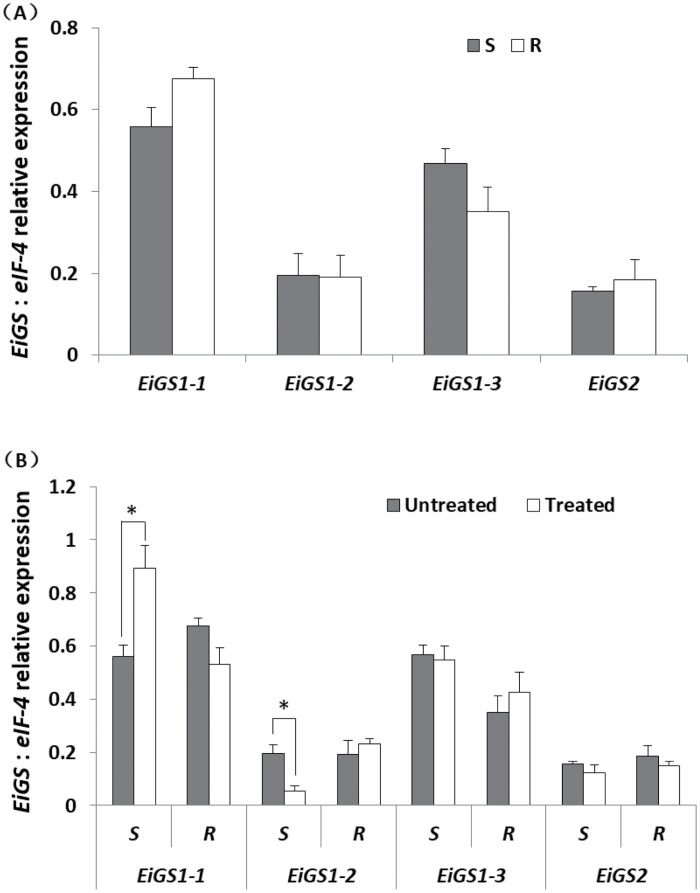
Fig. 2.
RT–qPCR analyses of EiGS iso-gene expression in leaf tissue of glufosinate-susceptible (S) and -resistant (R) E. indica (at the five-leaf stage). (A) Basal EiGS expression levels and (B) levels 24 h after glufosinate treatment (495 g ha−1). Data are means ±SE of three replicate samples each containing leaf material of five individual plants (∗ indicates significant difference according to the t-test, P<0.05).

