Fig. 1.
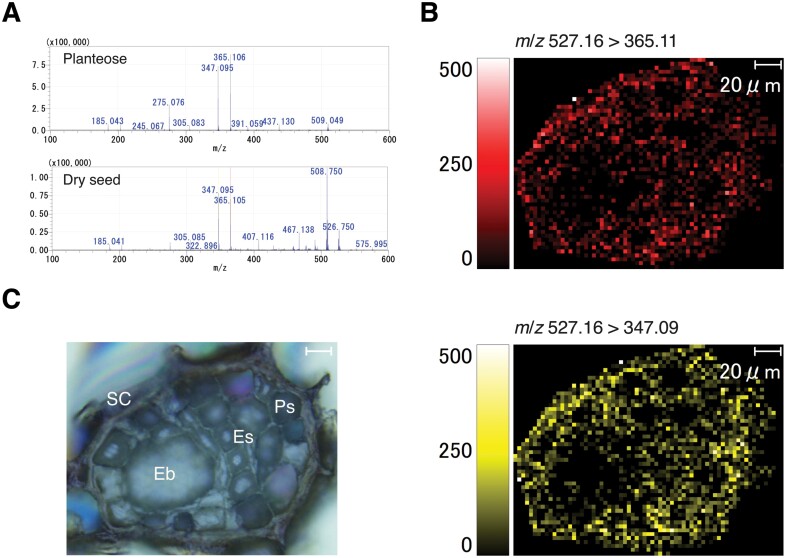
Mass imaging of planteose in dry seeds of O. minor. (A) MALDI–MS/MS spectra of purified planteose (upper panel) and O. minor dry seed (lower panel). 2,5-Dihydroxybenzoic acid was mixed with purified planteose or sprayed on a dry seed section as matrix, and m/z 527.16 [M+Na]+ was selected as a precursor ion. (B) Mass images of fragment ions m/z 365.11 (upper image) and 347.09 (lower image) from a precursor ion m/z 526.17. (C) Bright field image of an O. minor dry seed section. Eb, embryo; Es, endosperm, Ps, perisperm; SC, seed coat. Scale bar=20 µm.

