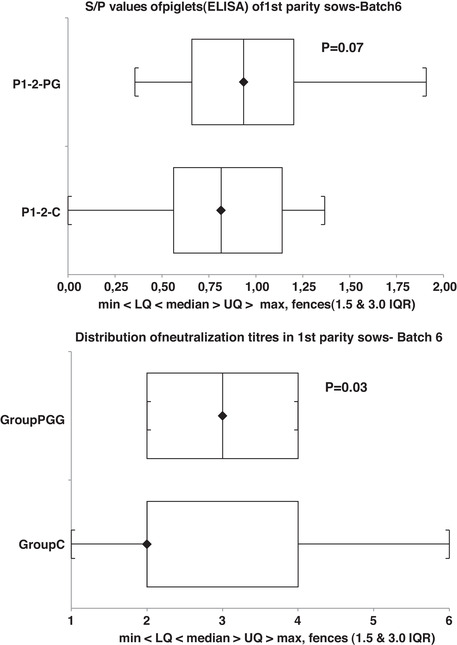
FIGURE 5.

S/P ratios (a) and neutralisation titres (log2) (b) per group (PG and C) in the offspring of parity 1 (P1) sows of Farm 1. Whiskers and boxes show minimum, lower quartile (25%), median, upper quartile (75%) and maximum. PG piglets tended to have higher S/P ratios at weaning than C sows (p = 0.09)
