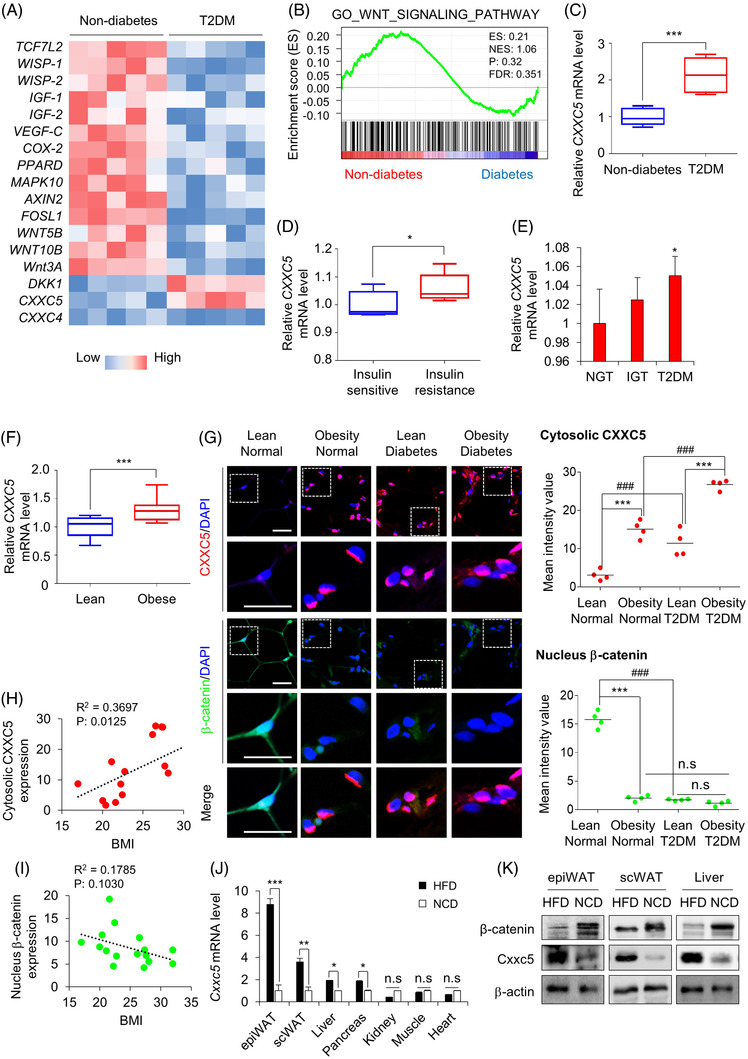
FIGURE 1.

Expression of CXXC5, an inhibitor of the Wnt/β‐catenin pathway, in human adipose tissues of patients with obesity‐induced diabetes. (A) Hierarchical clustering and heat‐map of RNA‐seq data in visceral adipose tissues from women with obesity‐induced diabetes (n = 5 for all groups). The colour scale shows Z‐score fragments per kilobase of transcript per million mapped reads representing the mRNA levels of each gene in the blue (low expression) to red (high expression) coloured scheme. (B) Gene set enrichment analysis of microarray transcriptome data from BMI‐matched patients with diabetes for Wnt/β‐catenin signalling‐activated gene signature. Black columns indicate 83 enriched genes in visceral adipose tissues of subjects with normal glucose tolerance or diabetes, involving the Wnt/β‐catenin signalling pathway (n = 17 for all groups). NES, normalized enrichment score; ES, enrichment score; FDR, false discovery rate. (C–F) Expression levels of CXXC5 in visceral adipose tissues from lean and obese subjects (GEO: GSE16415, GSE15773, GSE27951, GSE2508) (C), in visceral adipose tissues from BMI‐matched obese patients suffering from insulin sensitivity and resistance (n = 5 per group) (D), in subcutaneous adipose tissues from subjects with normal glucose tolerance (NGT), impaired glucose tolerance (IGT) and T2DM (n = 4 per group) (E), in subcutaneous adipose tissues from lean and obese subjects (n = 10 per group) (F). Expression levels of mRNA were normalized by non‐diabetes (C), insulin sensitive (D), NGT (E), lean group (F). (G–I) Visceral adipose tissues from human subjects that were lean, obese, diabetic and obese‐diabetic (n = 4 per group). Representative IHC images of CXXC5 and β‐catenin in visceral adipose tissue and quantitative analyses of IHC staining for CXXC5 and β‐catenin (G: upper panel). The quantitative mean intensity value of IHC staining of CXXC5 and β‐catenin was performed (G: lower panel), correlation of CXXC5 expression (H) and β‐catenin expression (I) with BMI. (J, K) Cxxc5+/+ mice were fed HFD or NCD for 8 weeks (n = 6 per group). Relative Cxxc5 mRNA expression in epiWAT, scWAT, liver, pancreas, kidney, muscle and heart tissues was normalized by NCD‐fed mice group (J) and β‐catenin and Cxxc5 expression in epiWAT, scWAT and liver tissues (n = 3 per group) (K). Scale bars = 100 μm. All data are presented as the mean ± SD. *p < 0.05, ***p < 0.001 determined by Student's t‐test. # p < 0.05, ## p < 0.01, ### p < 0.001 determined by Tukey's post hoc test
