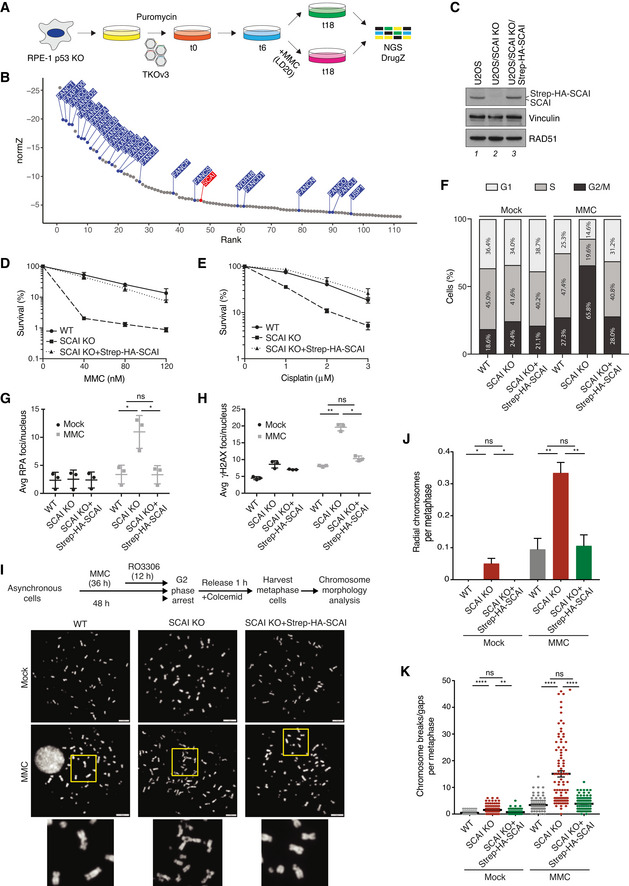
Schematic outline of genome‐scale CRISPR‐Cas9 screen for genes whose KO sensitizes human RPE‐1 cells to MMC. LD20, 20% lethal dose; NGS, next‐generation sequencing.
DrugZ analysis of sgRNA depletion in CRISPR screen in (A) following low‐dose MMC treatment (n = 2 technical replicates). FA genes are highlighted in blue; SCAI is highlighted in red.
Immunoblot analysis of U2OS WT, U2OS/SCAI KO, and U2OS/SCAI KO cells stably reconstituted with Strep‐HA‐SCAI (U2OS/SCAI KO/Strep‐HA‐SCAI).
Clonogenic survival of U2OS WT, U2OS/SCAI KO, and U2OS/SCAI KO/Strep‐HA‐SCAI cells subjected to indicated doses of MMC for 24 h (mean ± SEM; n = 3 independent experiments).
As in (D), except that cells were treated with Cisplatin for 24 h (mean ± SEM; n = 3 independent experiments).
U2OS WT, U2OS/SCAI KO, and U2OS/SCAI KO/Strep‐HA‐SCAI cells were treated or not with MMC (9 nM) for 48 h, fixed, and co‐stained with PCNA antibody and DAPI. Cell cycle distribution was analyzed by quantitative image‐based cytometry (QIBC) (≥ 2,000 cells analyzed per condition). Data from a representative experiment are shown.
U2OS WT, U2OS/SCAI KO, and U2OS/SCAI KO/Strep‐HA‐SCAI cells were treated or not with MMC (90 nM) for 1 h, fixed 24 h later, and co‐stained with RPA2 antibody and DAPI. RPA2 foci were quantified by QIBC (≥ 3,000 cells analyzed per condition; mean ± SD; n = 3 independent experiments; *P < 0.05; ns, not significant, two‐tailed paired t‐test).
As in (G), except that cells were co‐stained with γH2AX antibody and DAPI (≥ 3,000 cells analyzed per condition; mean ± SD; n = 3 independent experiments; *P < 0.05; **P < 0.01; ns, not significant, two‐tailed paired t‐test).
Experimental workflow for metaphase chromosome morphology analysis (top) and representative images of metaphase spreads from indicated cell lines treated or not with MMC (bottom). DNA was stained with DAPI. Scale bars, 10 µm.
Quantification of radial chromosomes in (I) (mean ± SD; 180 cells analyzed per condition; n = 3 independent experiments; *P < 0.05; **P < 0.01, ns, not significant, two‐tailed t‐test).
Quantification of chromosomal breaks/gaps in (I) (mean ± SEM; 99 metaphase cells analyzed for each condition pooled from three independent experiments; **P < 0.01; ****P < 0.0001, ns, not significant, Mann–Whitney U test).

