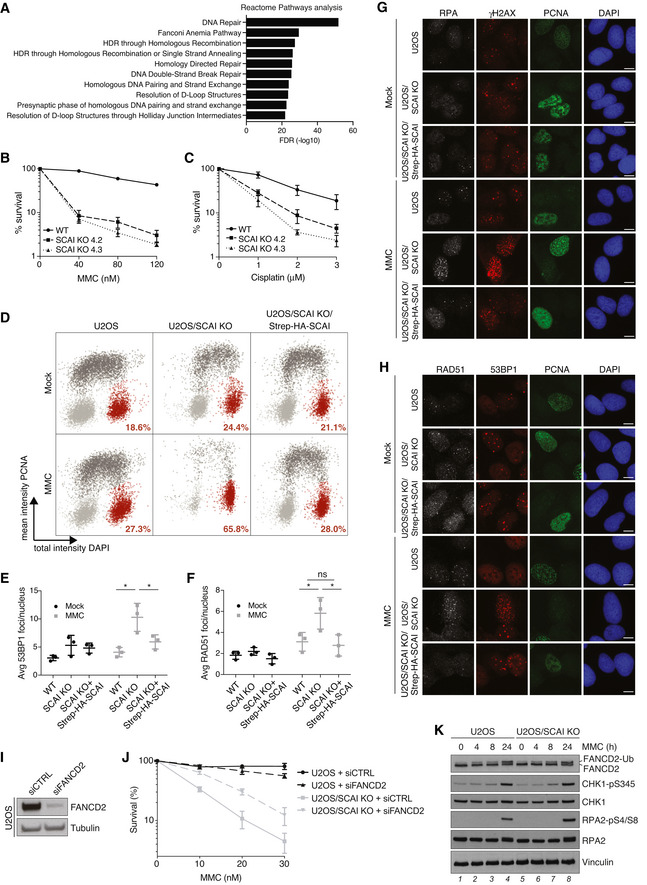
GO term analysis of significant hits (NormZ < −3) in CRISPR‐Cas9 screen in Fig
1A, using Reactome pathways from PANTHER16.0.
Clonogenic survival of U2OS WT and U2OS/SCAI KO cells subjected to indicated doses of MMC for 24 h (mean ± SEM; n = 3 independent experiments).
As in (B), except that cells were treated with indicated doses of cisplatin for 24 h (mean ± SEM; n = 3 independent experiments).
Scatter plot showing cell cycle distribution of cells in Fig
1F. Light grey, G1 phase; dark grey, S phase; red: G2/M phase. Proportion of cells in G2/M phase is indicated.
U2OS WT, U2OS/SCAI KO, and U2OS/SCAI KO/Strep‐HA‐SCAI cells were treated or not with MMC (90 nM) for 1 h, fixed 24 h later, and co‐stained with 53BP1 antibody and DAPI. 53BP1 foci were quantified by QIBC (≥ 3,000 cells analyzed per condition; mean ± SD; n = 3 independent experiments; *P < 0.05; two‐tailed paired t‐test).
As in (E), except that cells were stained with RAD51 antibody (≥ 3,000 cells analyzed per condition; mean ± SD; n = 3 independent experiments; *P < 0.05; ns, not significant, two‐tailed paired t‐test).
Representative images of the experiments in Fig
1G and H. Scale bar, 10 µm.
Representative images of the experiments in (E) and (F). Scale bar, 10 µm.
Immunoblot analysis of FANCD2 siRNA knockdown efficiency in U2OS cells.
Clonogenic survival of U2OS and U2OS/SCAI KO cells transfected with non‐targeting control (CTRL) or FANCD2 siRNAs and subjected to indicated doses of MMC for 24 h (mean ± SEM; n = 3 independent experiments).
Immunoblot analysis of U2OS WT and U2OS/SCAI KO cells harvested at the indicated times after exposure to MMC (0.5 µM).

