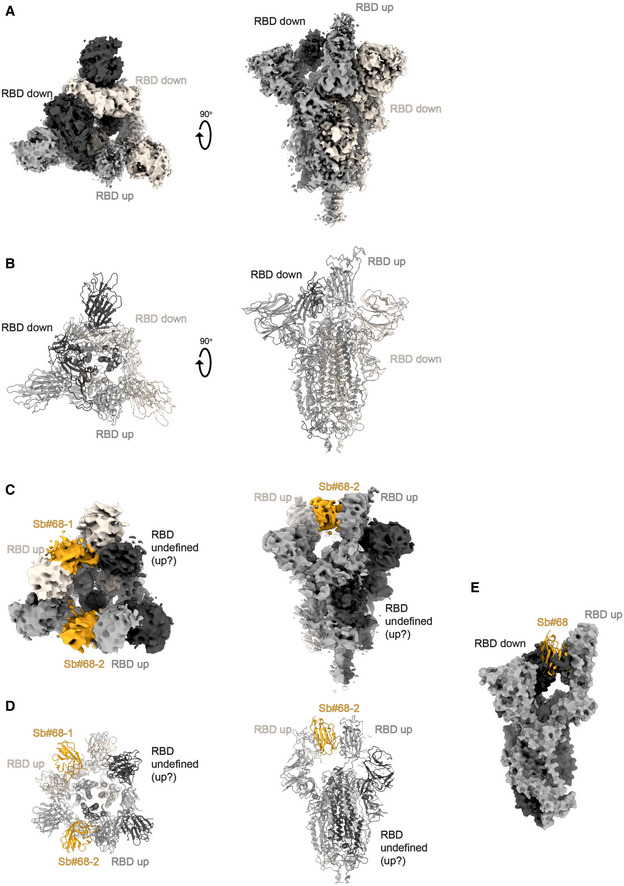
Figure EV4. Structural analysis of S‐2P/Sb#68 complex.

- Cryo‐EM map of S‐6P, with an 1up/2down RBD conformation.
- The corresponding model is shown as ribbon (PDB ID:6ZGG for S‐6P). No densities for Sb#68 were observed.
- Cryo‐EM map of S‐6P, with two Sb#68 bound to up‐RBDs of the spike featuring a 2up/1flexible conformation.
- The corresponding model built on pre‐existing structures (PDB ID:6X2B for S‐6P; PDB ID:5M13 for Sb#68) is shown as ribbon.
- Sb#68 cannot bind to up‐RBD if the neighboring RBD exhibits a down conformation due to steric clashing. Final maps blurred to a B factor of −30 Å were used for better clarity of the less resolved RBDs and sybodies. Spike protein is shown in shades of gray and Sb#68 in orange.
