
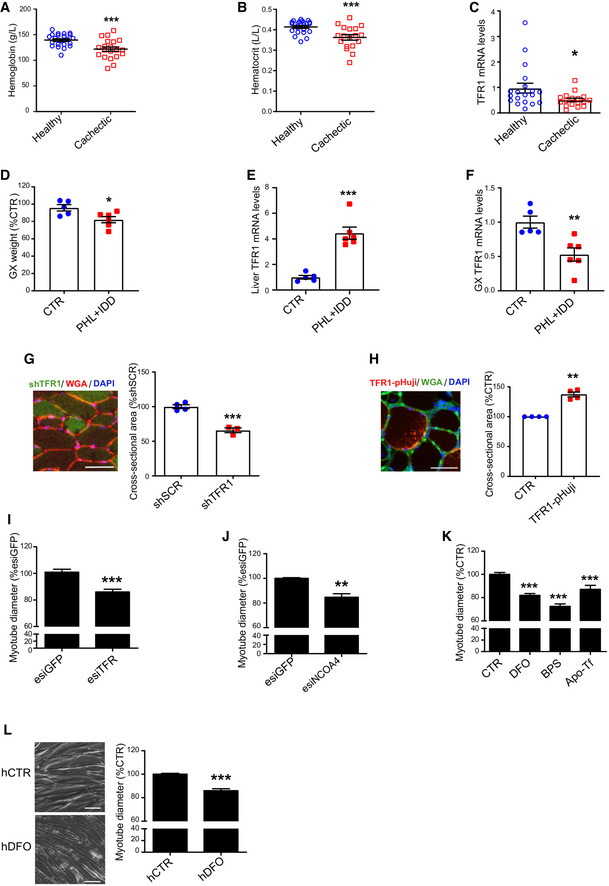
Figure 1. Iron deficiency induces skeletal muscle atrophy.
-
A, BHemoglobin (A) and hematocrit (B) levels of healthy subjects and cachectic cancer patients presenting a body weight loss superior to 10% of initial body weight (19 healthy subjects, 17 cachectic patients).
-
CTFR1 mRNA levels in muscle biopsies from cancer patients of late stage cachexia with at least 10% total body weight loss (19 healthy subjects, 17 cachectic patients).
-
DGastrocnemius weight in mice subjected to iron deprivation by feeding with an iron‐deficient diet (IDD) combined to a phlebotomy (PHL) (n = 5–6).
-
ETFR1 mRNA levels in the liver of mice subjected to iron deprivation by feeding with an iron‐deficient diet (IDD) combined to a phlebotomy (PHL) (n = 5–6).
-
FTFR1 mRNA levels in the gastrocnemius of mice subjected to iron deprivation by feeding with an iron‐ deficient diet (IDD) combined to a phlebotomy (PHL) (n = 5–6).
-
GCross‐sectional area of skeletal muscle fibers transfected with shSCR (scramble) and shTFR1 (n = 3–4) and representative picture of shTFR1 transfected fibers. Scale bar = 50 µm.
-
HCross‐sectional area of skeletal muscle fibers transfected with TFR‐pHuji (n = 4) and representative picture of TFR‐pHuji transfected fibers. Scale bar = 50 µm.
-
I, JDiameter of TFR1 (I) or NCOA4 (J) knocked down C2C12 myotubes at day 3 post‐transfection (n = 7 and n = 3 respectively).
-
KDiameter of C2C12 myotubes after 48 h treatment with Deferoxamine (DFO), bathophenanthroline disulfonate (BPS), or apo‐transferrin (Apo‐Tf).
-
LRepresentative pictures and diameter measurements of human myoblast‐derived myotubes after 48 h treatment with DFO (n = 3). Scale bar = 50 µm.
Data information: For all data, n represents the number of biological replicates. Statistical significance was calculated by unpaired, two‐tailed Student’s t‐test. Data are mean ± SEM. *P < 0.05, **P < 0.01, ***P < 0.001.
Source data are available online for this figure.