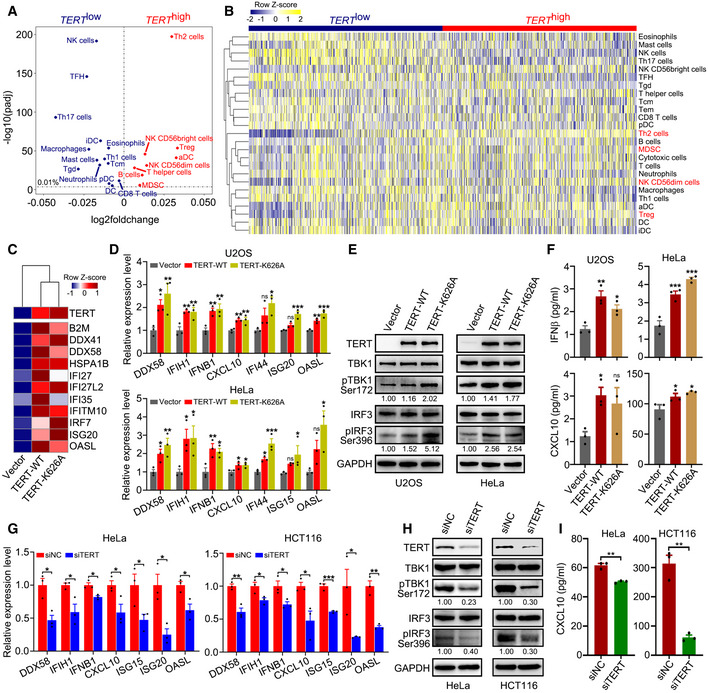
Figure 1. TERT expression is associated with immunosuppressive signatures and triggers interferon response.

-
AScatterplot representing differences in ssGSEA immune signatures in TERT high versus TERT low tumours (n = 4,632 tumours in each group) across TCGA. −log10(padj) for enrichment of ssGSEA immune signatures in TERT high versus TERT low tumours is shown on the y‐axis. Signatures more highly represented in TERT high tumours are shown on the right, while those in TERT low tumours are shown on the left.
-
BHeat map for ssGSEA of immune signatures in TERT high and TERT low tumours (n = 4,632 tumours in each group) across TCGA. Th1, Th2, Th17: T helper 1, 2, 17 cells, Tcm: central memory T cells, Tem: effector memory T cells, Tgd: gamma delta T cells, TFH: follicular helper T cells, Treg: regulatory T cells, MDSC: myeloid‐derived suppressor cells, DC: dendritic cells, aDC: activated DCs, iDC: immature DCs, pDC: plasmacytoid DCs, NK cells: natural killer cells.
-
CHeat map of interferon‐related genes in U2OS cells with TERT‐WT or TERT‐K626A ectopic expression.
-
D–FRT–qPCR analysis of interferon‐related genes (D), western blot analysis of TERT, TBK1, pTBK1, IRF3, pIRF3, and GAPDH levels (E), and ELISA of IFNβ and CXCL10 in culture supernatant (F) in U2OS and HeLa cells ectopically expressing TERT‐WT or TERT‐K626A.
-
G–IRT–qPCR analysis of interferon‐related genes (G), western blot analysis of TERT, TBK1, pTBK1, IRF3, pIRF3, and GAPDH levels (H), and ELISA analysis of CXCL10 in culture supernatant (I) in HeLa and HCT116 cells with TERT knockdown.
Data information: Data represent mean ± SEM of three biological replicates (D, F, G and I). *P < 0.05, **P < 0.01, ***P < 0.001, ns, not significant. One‐way ANOVA with Fisher's LSD tests was used for (D) and (F), unpaired two‐tailed Student’s t‐tests were used for (G) and (I). Relative levels of pTBK1 and pIRF3 were quantified with ImageJ software and normalized to GAPDH, as indicated at the bottom of the blot (E and H).
Source data are available online for this figure.
